
KubeBlocks for
VictoriaMetrics
VictoriaMetrics is a fast, cost-effective, and scalable time-series database and monitoring solution. It is fully compatible with Prometheus and Grafana, offering superior compression, high ingestion rates, and global query views across multiple data sources.
Supported versions
Available on
 AWS
AWS Azure
Azure GCP
GCP OCI
OCI Alibaba Cloud
 Rancher
 OpenShift
Databases
 MySQL
MySQL PostgreSQLOracle
 SQL Server
 Redis
Redis MongoDB
 ClickHouse
Vector & AI
 Qdrant
 Milvus
 Elasticsearch
Message queues
 RocketMQ
 RabbitMQ
 Kafka
KafkaOthers
 VictoriaMetrics
 InfluxDB
 etcd
etcd ZooKeeper
Extend database engines like plug-ins
KubeBlocks provides unified database operations through its addon-based architecture. With KubeBlocks Enterprise, access over 15 seamless integrations to scale your database services.
One control plane, consistent operations across all engines — powered by the addon mechanism.
Run VictoriaMetrics with guided lifecycle, scaling, observability, and access workflows
Operate VictoriaMetrics with a rich create wizard, dedicated horizontal, compute, and storage scaling dialogs, live metrics, runtime logs, IP whitelist controls, and task history evidence backed by real KubeBlocks Enterprise screenshots.
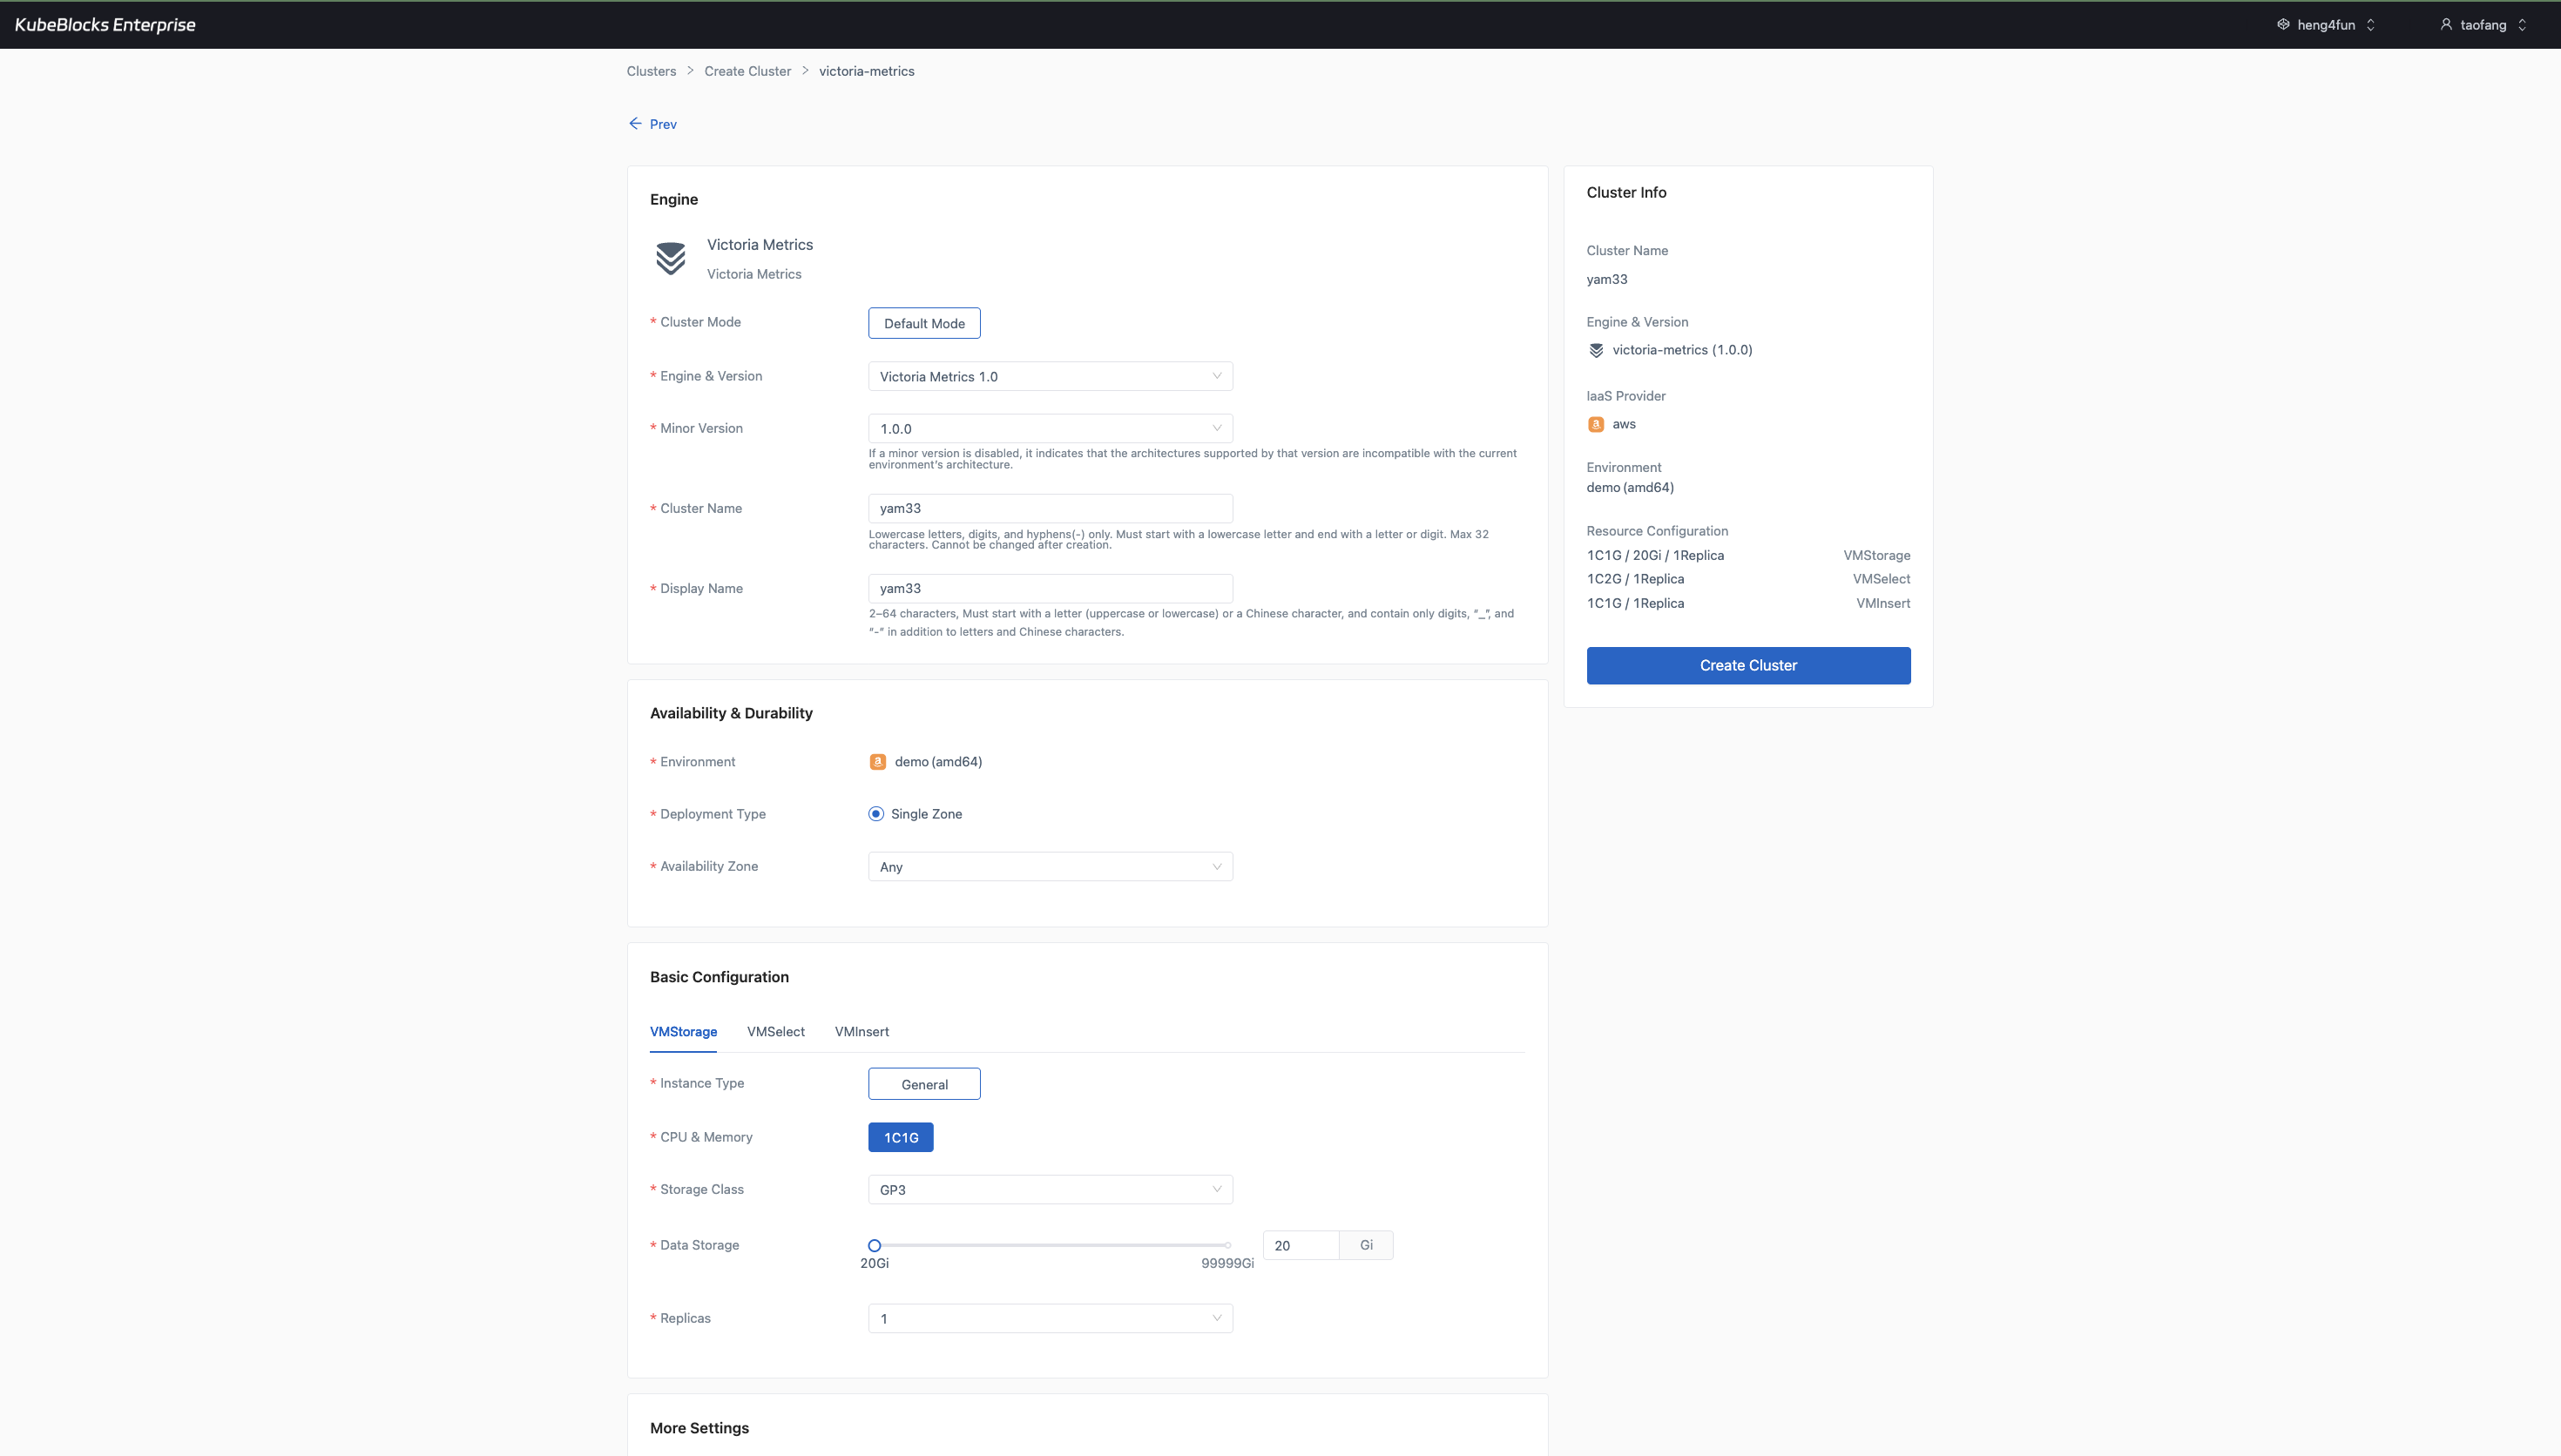
The create wizard keeps VictoriaMetrics topology, compute, storage, version, and environment choices visible before provisioning.
Create VictoriaMetrics clusters with topology and sizing choices visible
Launch VictoriaMetrics from a guided create wizard that keeps cluster mode, engine version, environment, VMStorage sizing, VMSelect sizing, VMInsert sizing, storage class, storage size, replica count, and maintenance window visible before provisioning begins.
- Review the real `victoria-metrics` create wizard before users create the cluster.
- Keep VMStorage, VMSelect, and VMInsert component sizing visible in the same workflow as version and environment choices.
- Confirm the generated cluster summary before the deployment moves into the day-2 operations workspace.
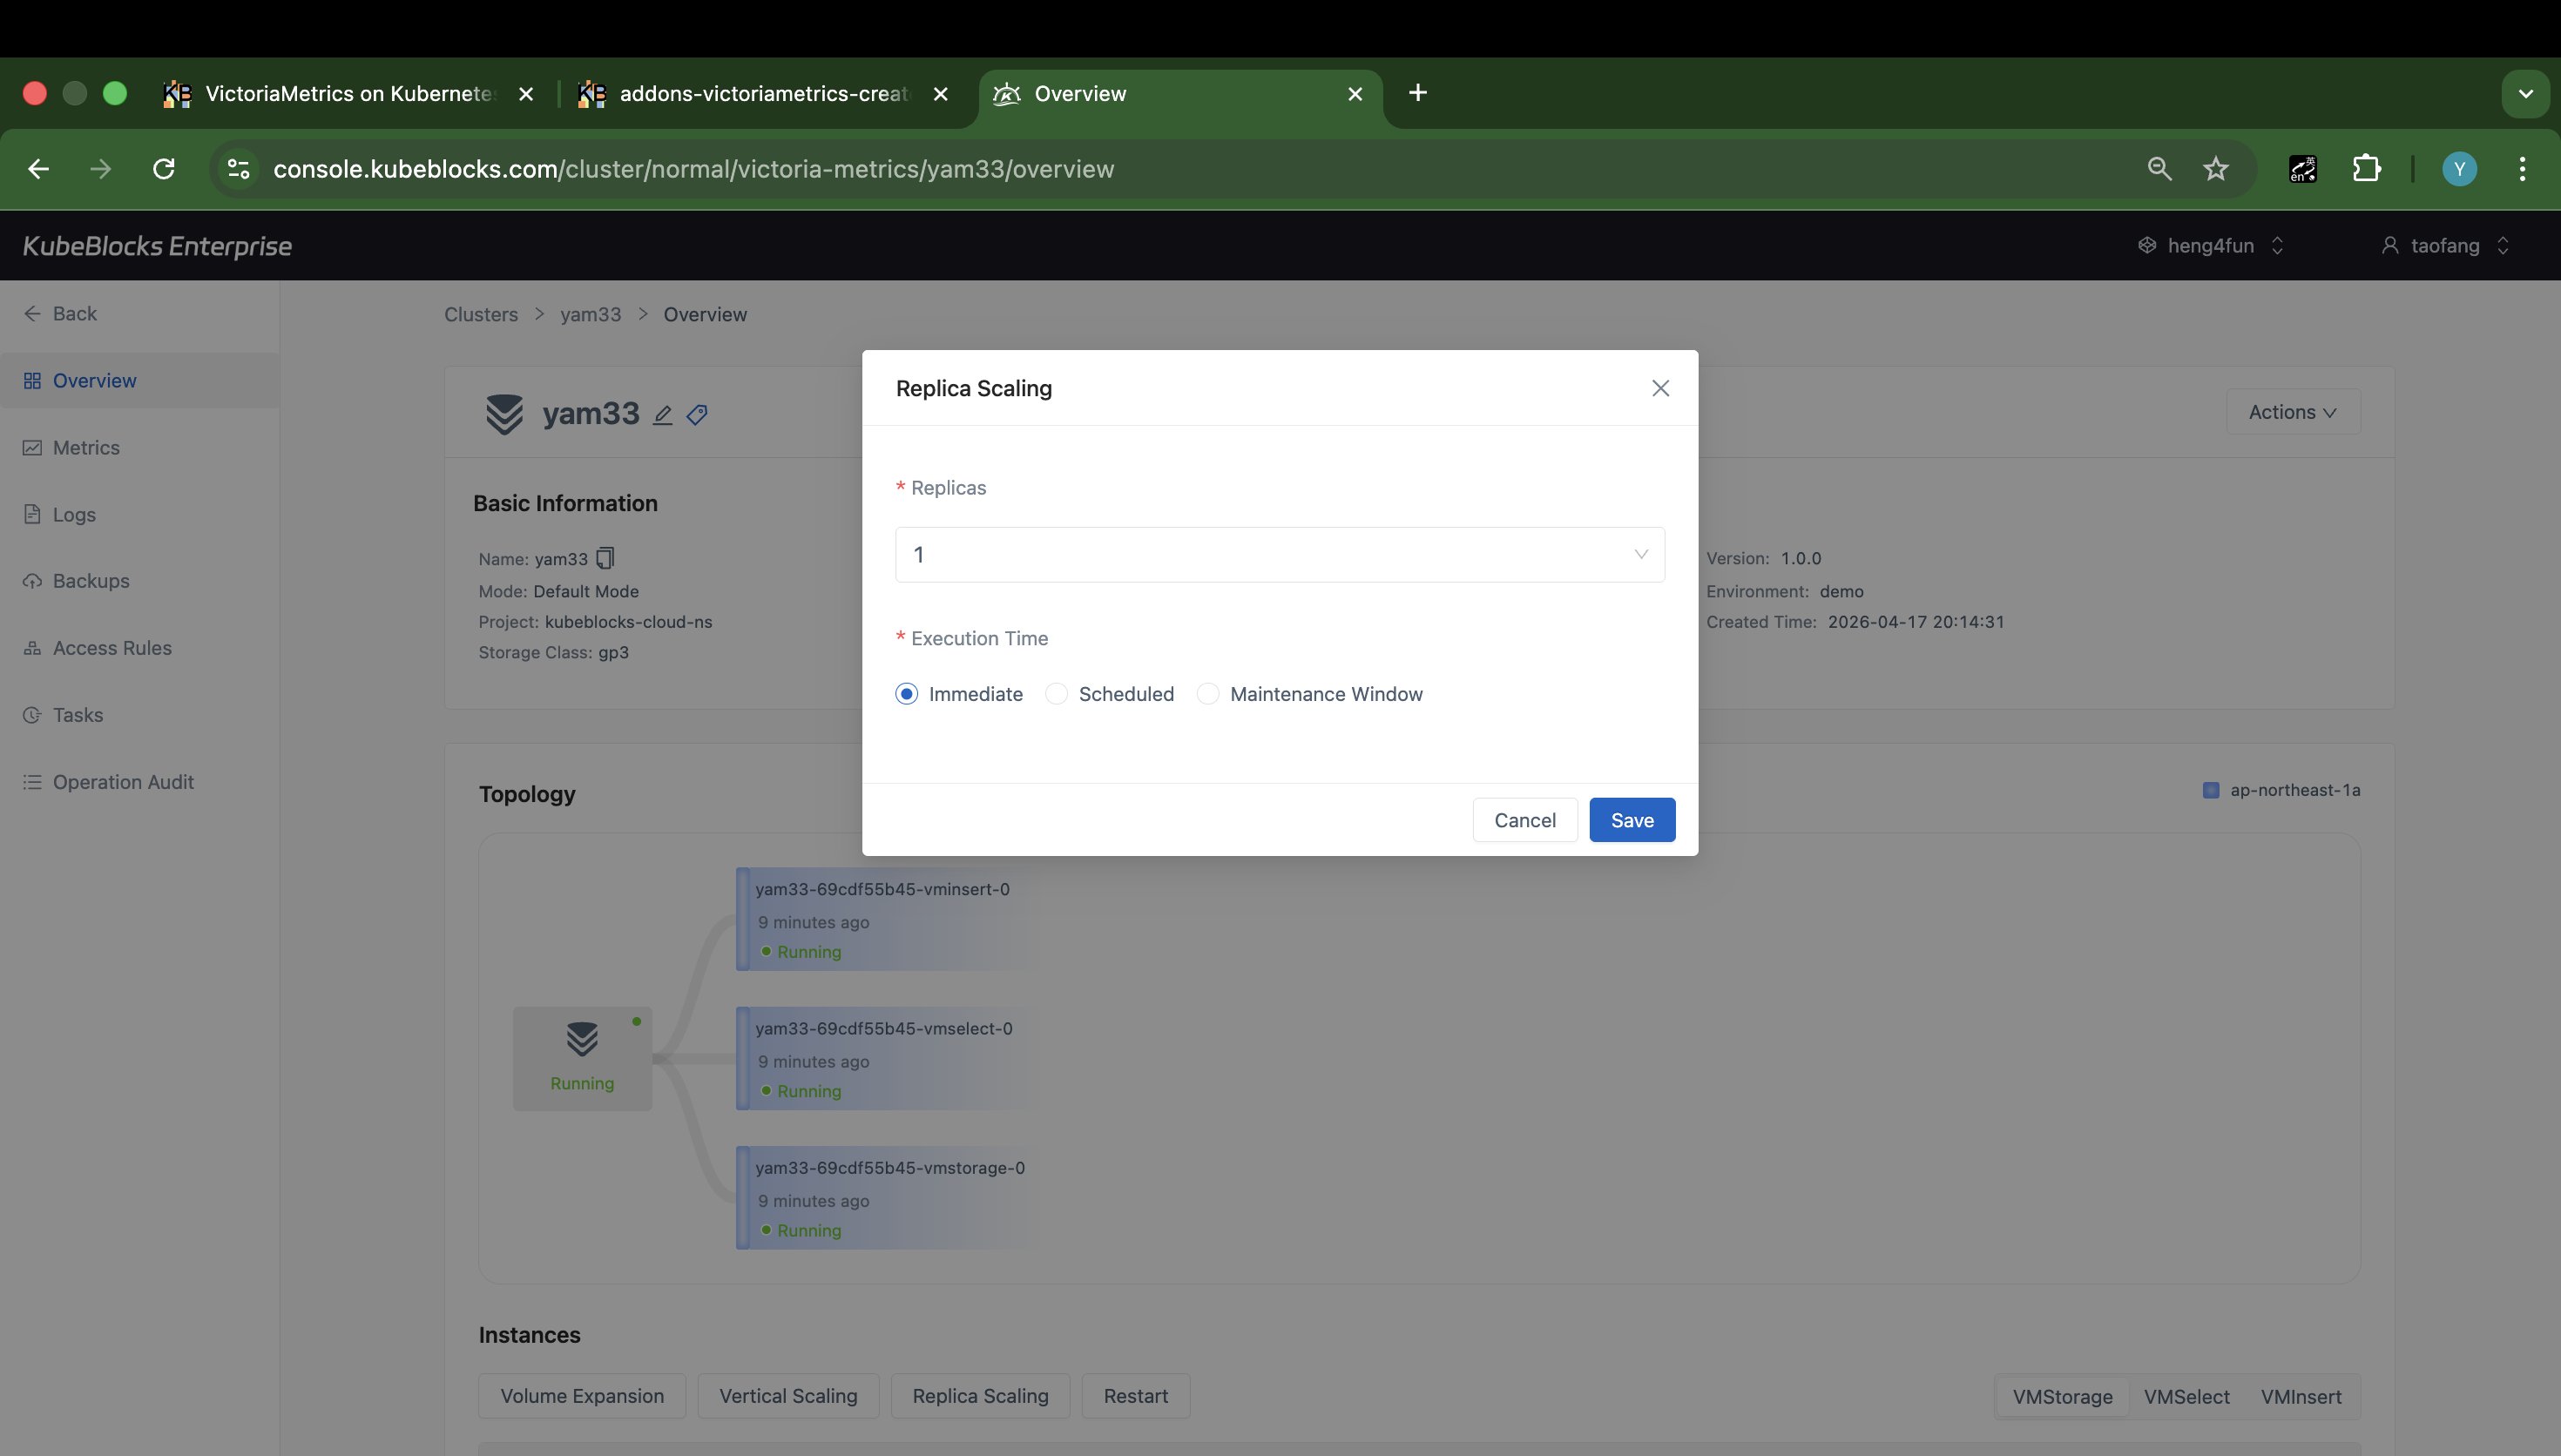
Horizontal Scaling keeps VictoriaMetrics replica changes visible before users save a topology update.
Adjust VictoriaMetrics replicas from a dedicated scaling dialog
Horizontal Scaling gives users a focused place to review the current replica setting and execution timing before changing VictoriaMetrics replica capacity.
- Open Horizontal Scaling directly from the VictoriaMetrics overview instead of relying on a task-status page.
- Review the current replica setting before users save a topology change.
- Choose Immediate, Scheduled, or Maintenance Window execution timing before submitting the replica update.
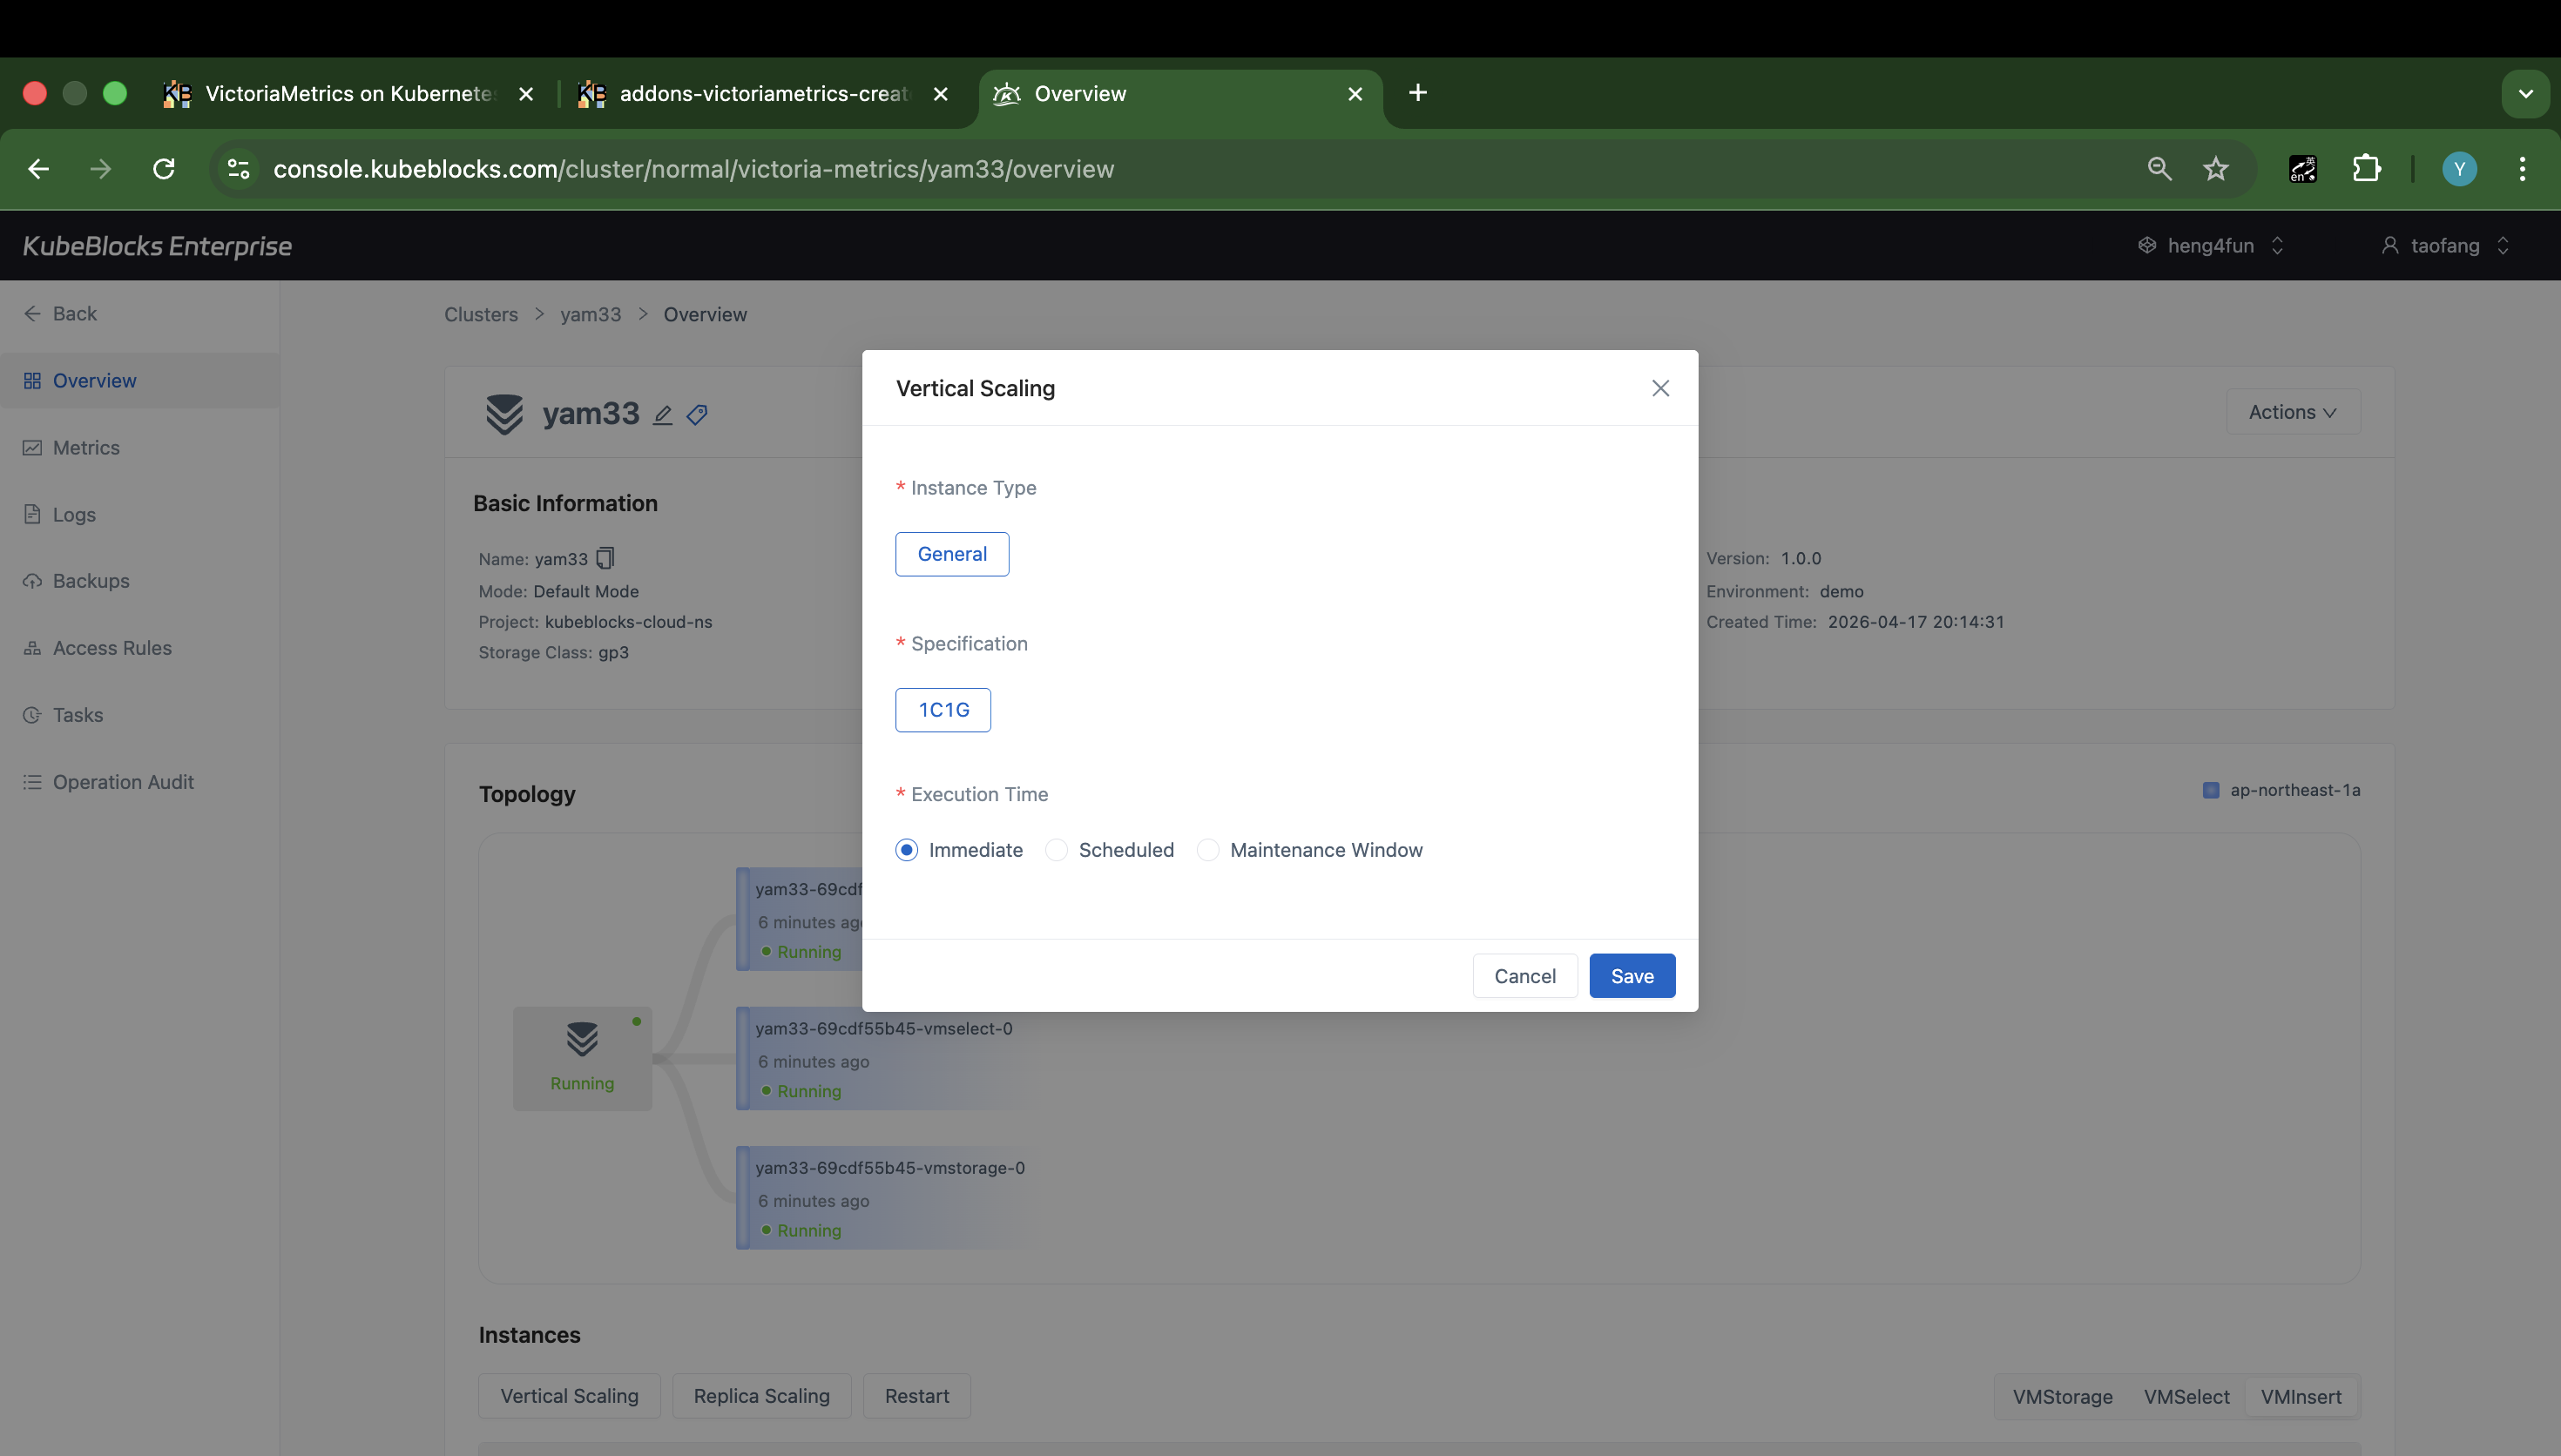
Vertical Scaling shows VictoriaMetrics compute-change controls before users save a resource update.
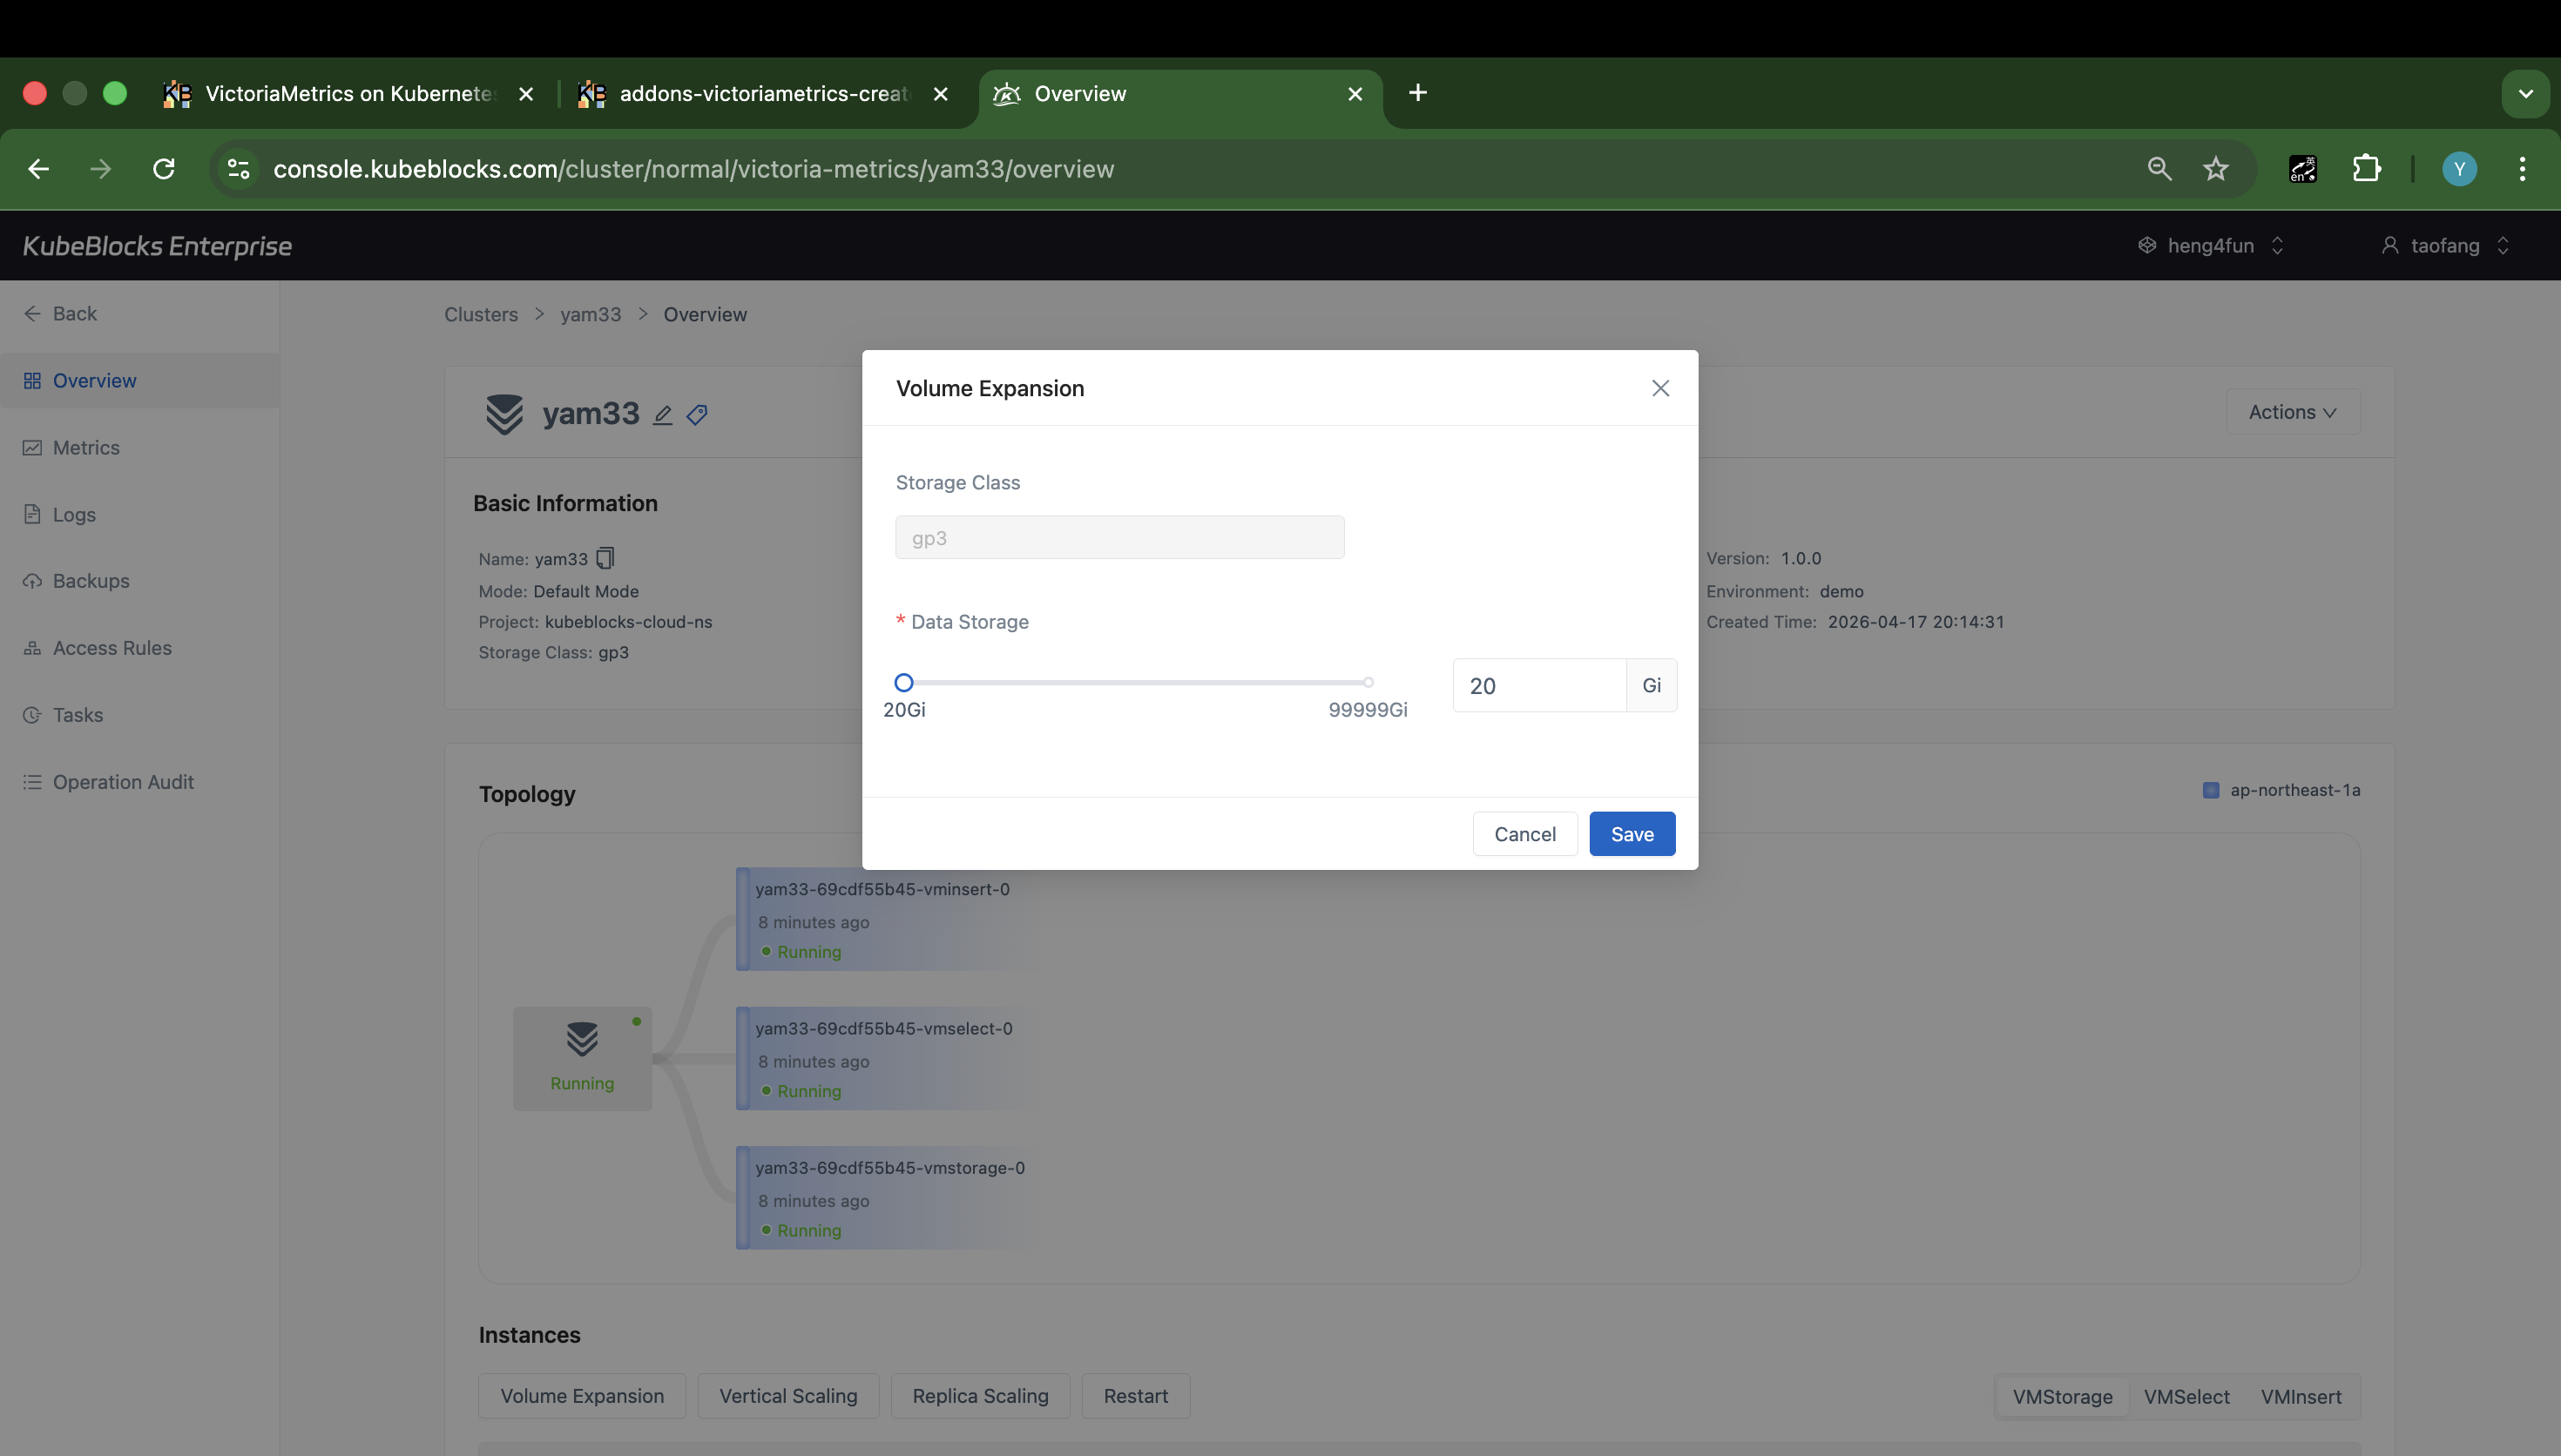
Volume Expansion keeps the storage class, current capacity, target capacity, and save action visible in one dialog.
Resize VictoriaMetrics compute and storage from separate dialogs
Vertical Scaling and Volume Expansion keep CPU, memory, and disk growth separate from replica-count changes, so users can review the actual scaling controls before submitting an operation.
- Use Vertical Scaling to review VictoriaMetrics compute sizing and execution timing before applying a resource change.
- Use Volume Expansion to review the storage class, current capacity, and target capacity before growing disks.
- Keep scaling evidence focused on the real pre-submit dialogs instead of post-submit task status.
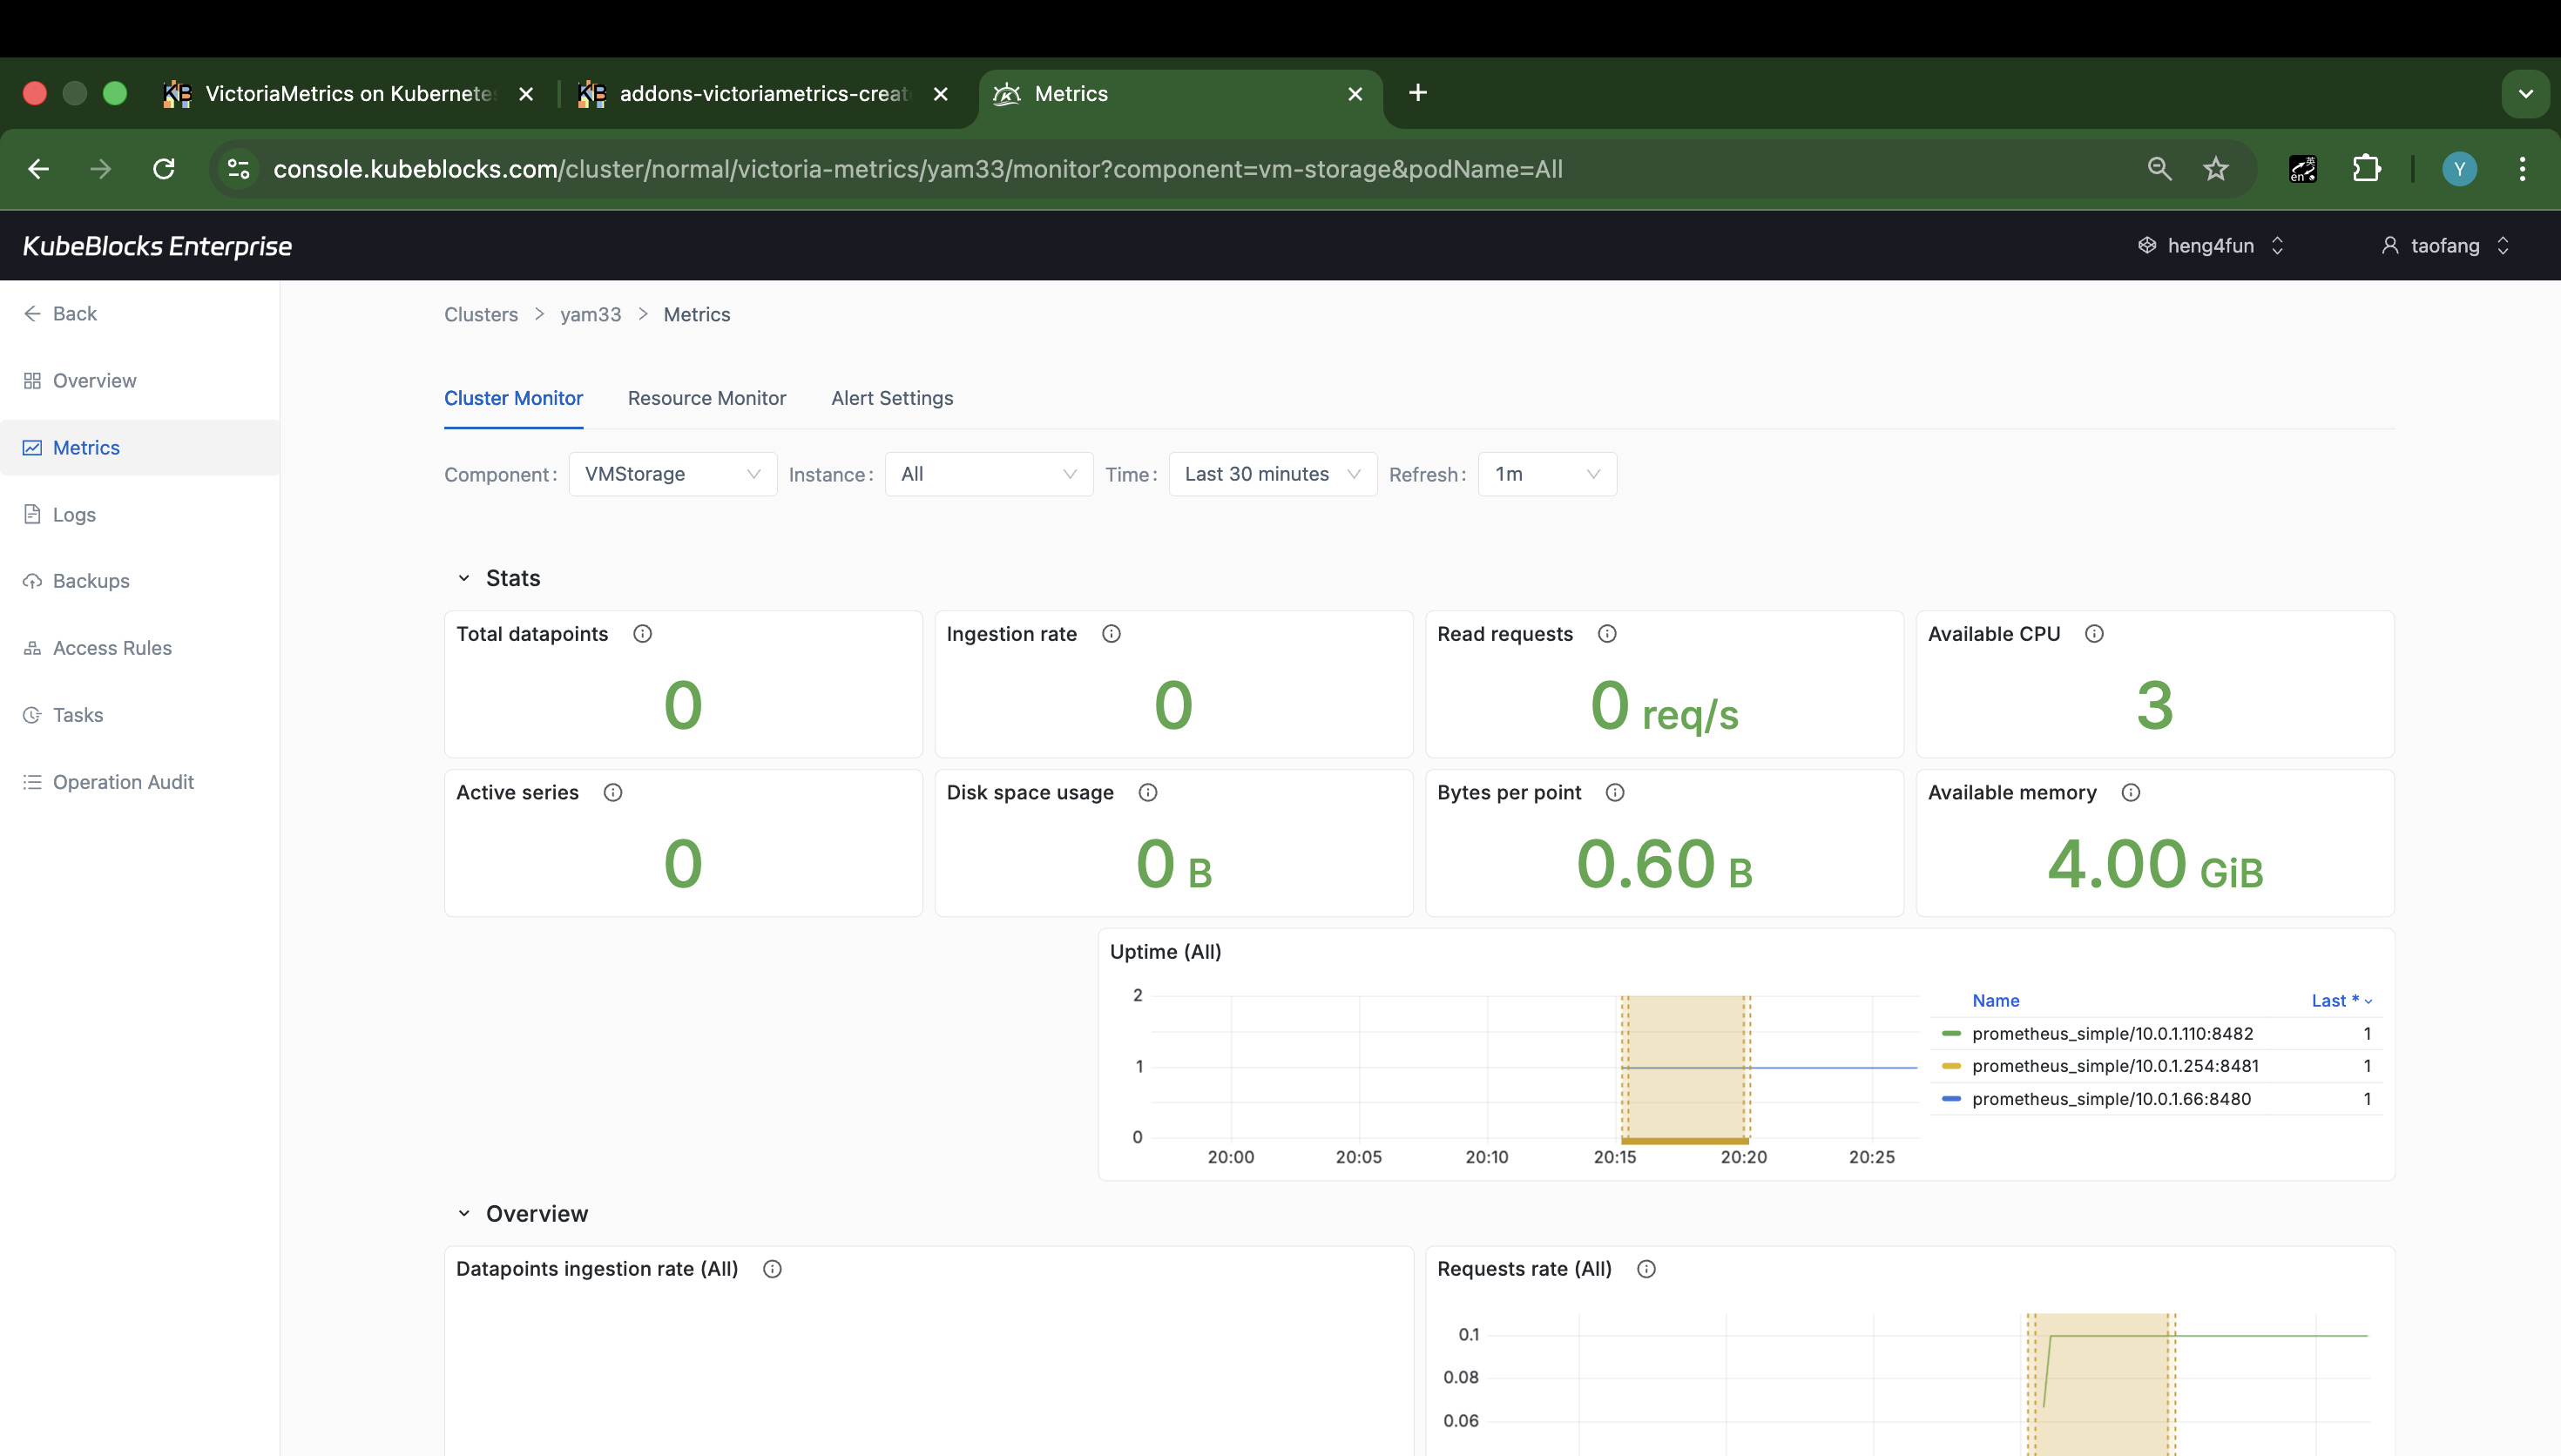
Cluster Monitor gives users a live view into VictoriaMetrics health and component behavior.
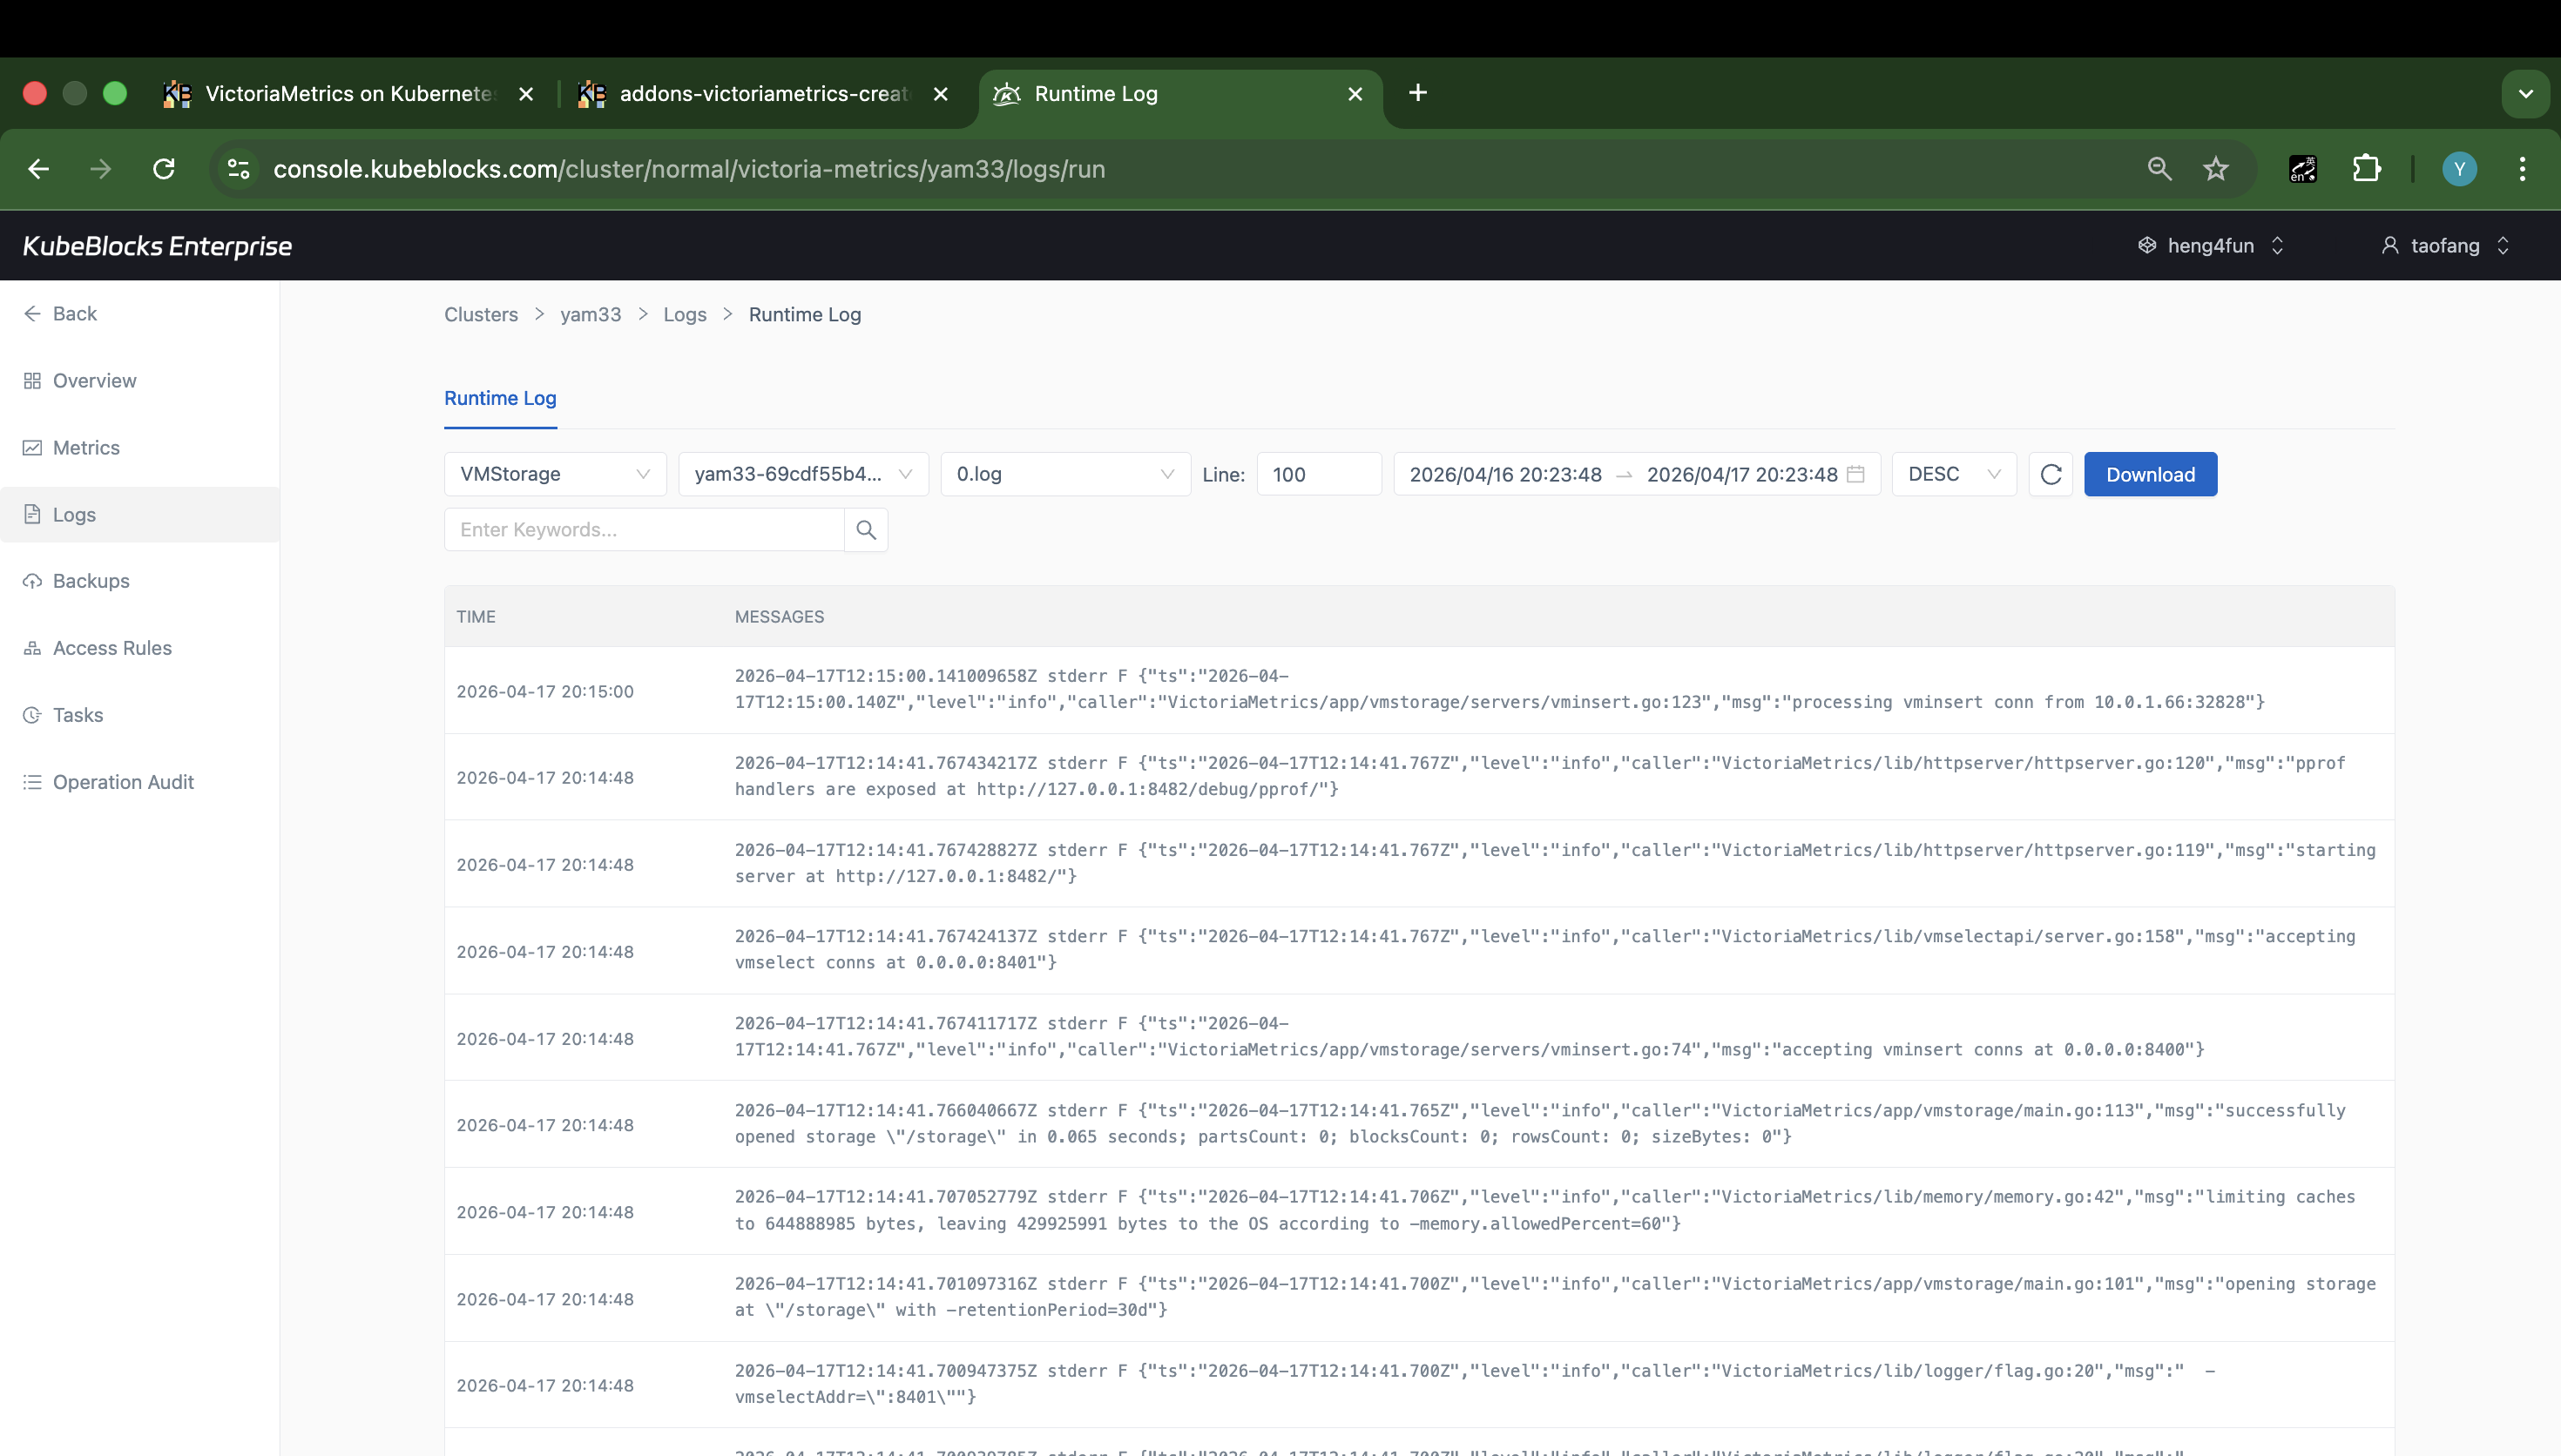
Runtime Log captures real VictoriaMetrics service output for troubleshooting and operational validation.
Track VictoriaMetrics health with metrics and runtime logs
Use Cluster Monitor to watch service health, then pivot into Runtime Log when users need instance-level troubleshooting details without leaving the cluster workspace.
- Monitor VictoriaMetrics stats and charts from Cluster Monitor after the dashboard hydrates.
- Inspect Runtime Log output from the live cluster when users need service-level troubleshooting evidence.
- Keep metrics and logs close to the same day-2 surface used for lifecycle and scaling work.
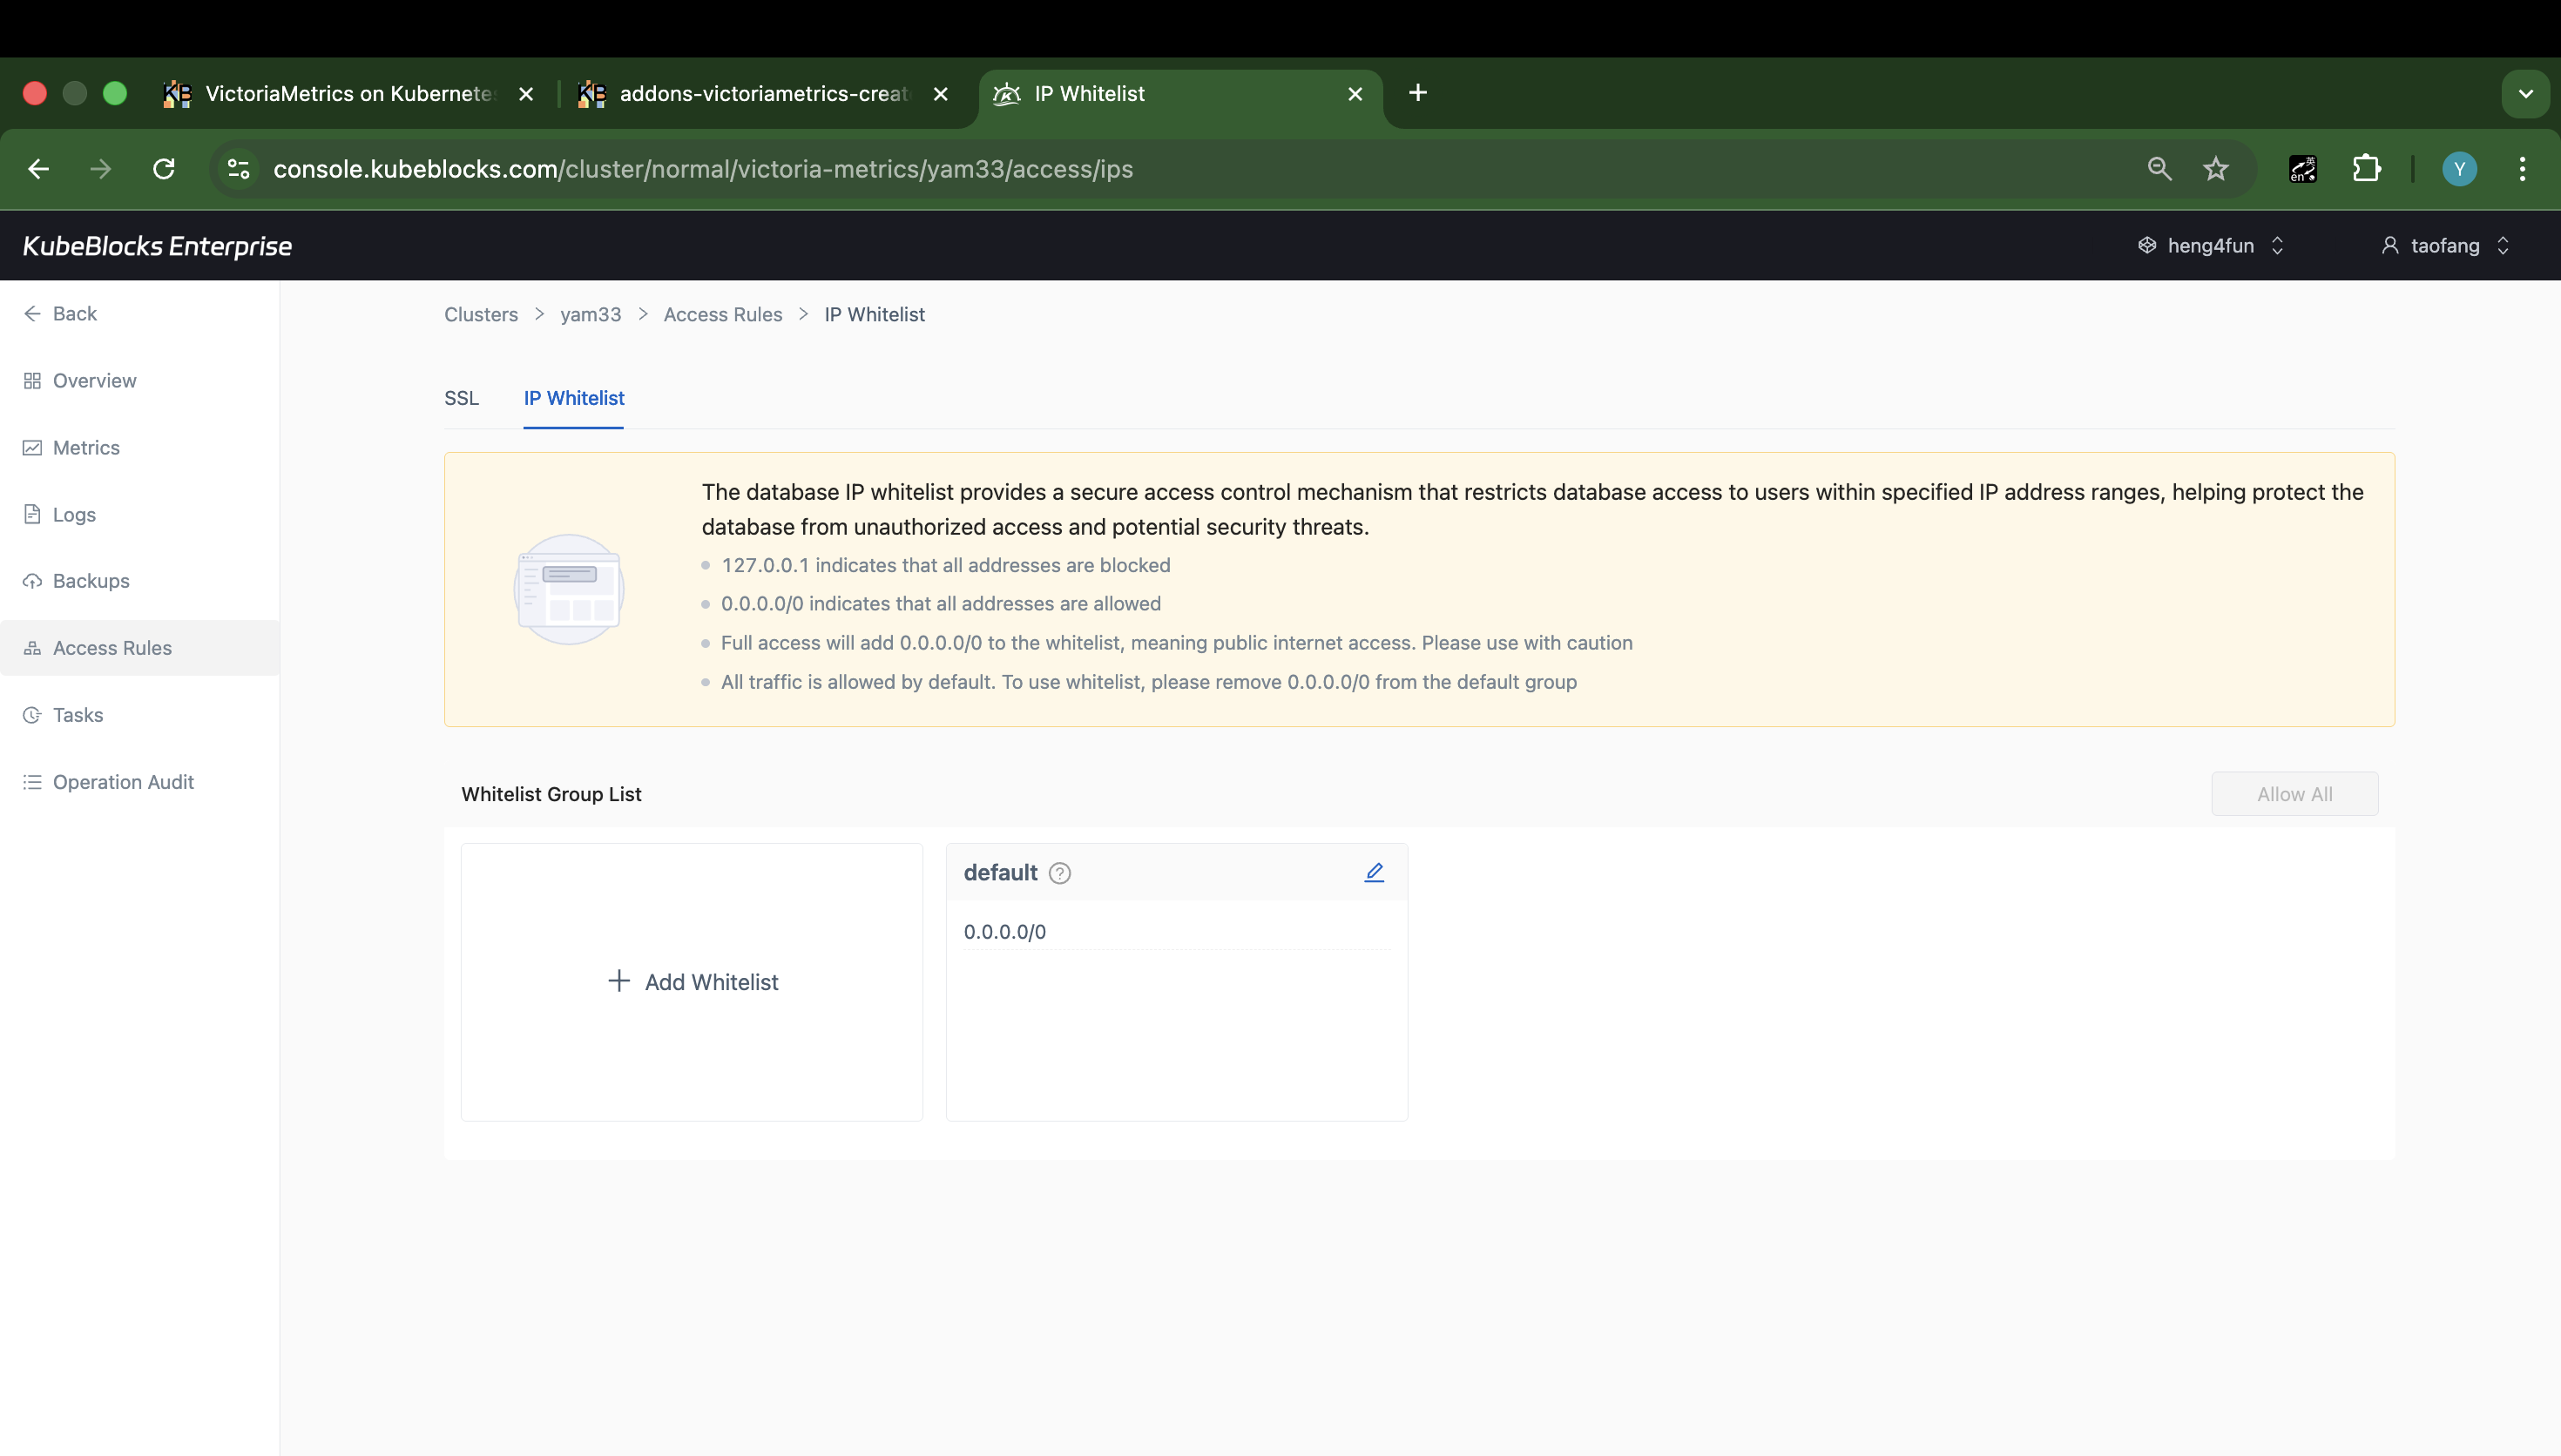
The IP Whitelist page shows the current default group and where users add or tighten source access rules.
Control VictoriaMetrics access with IP whitelist groups
Access Rules keeps SSL and IP Whitelist controls together. The IP Whitelist page shows the default group, current CIDR entries, and the actions users use to allow or tighten source ranges.
- Open the IP Whitelist tab directly from the VictoriaMetrics cluster workspace.
- Review the default whitelist group and the current `0.0.0.0/0` entry before narrowing source access.
- Add stricter whitelist groups from the same page when users need more controlled network access.
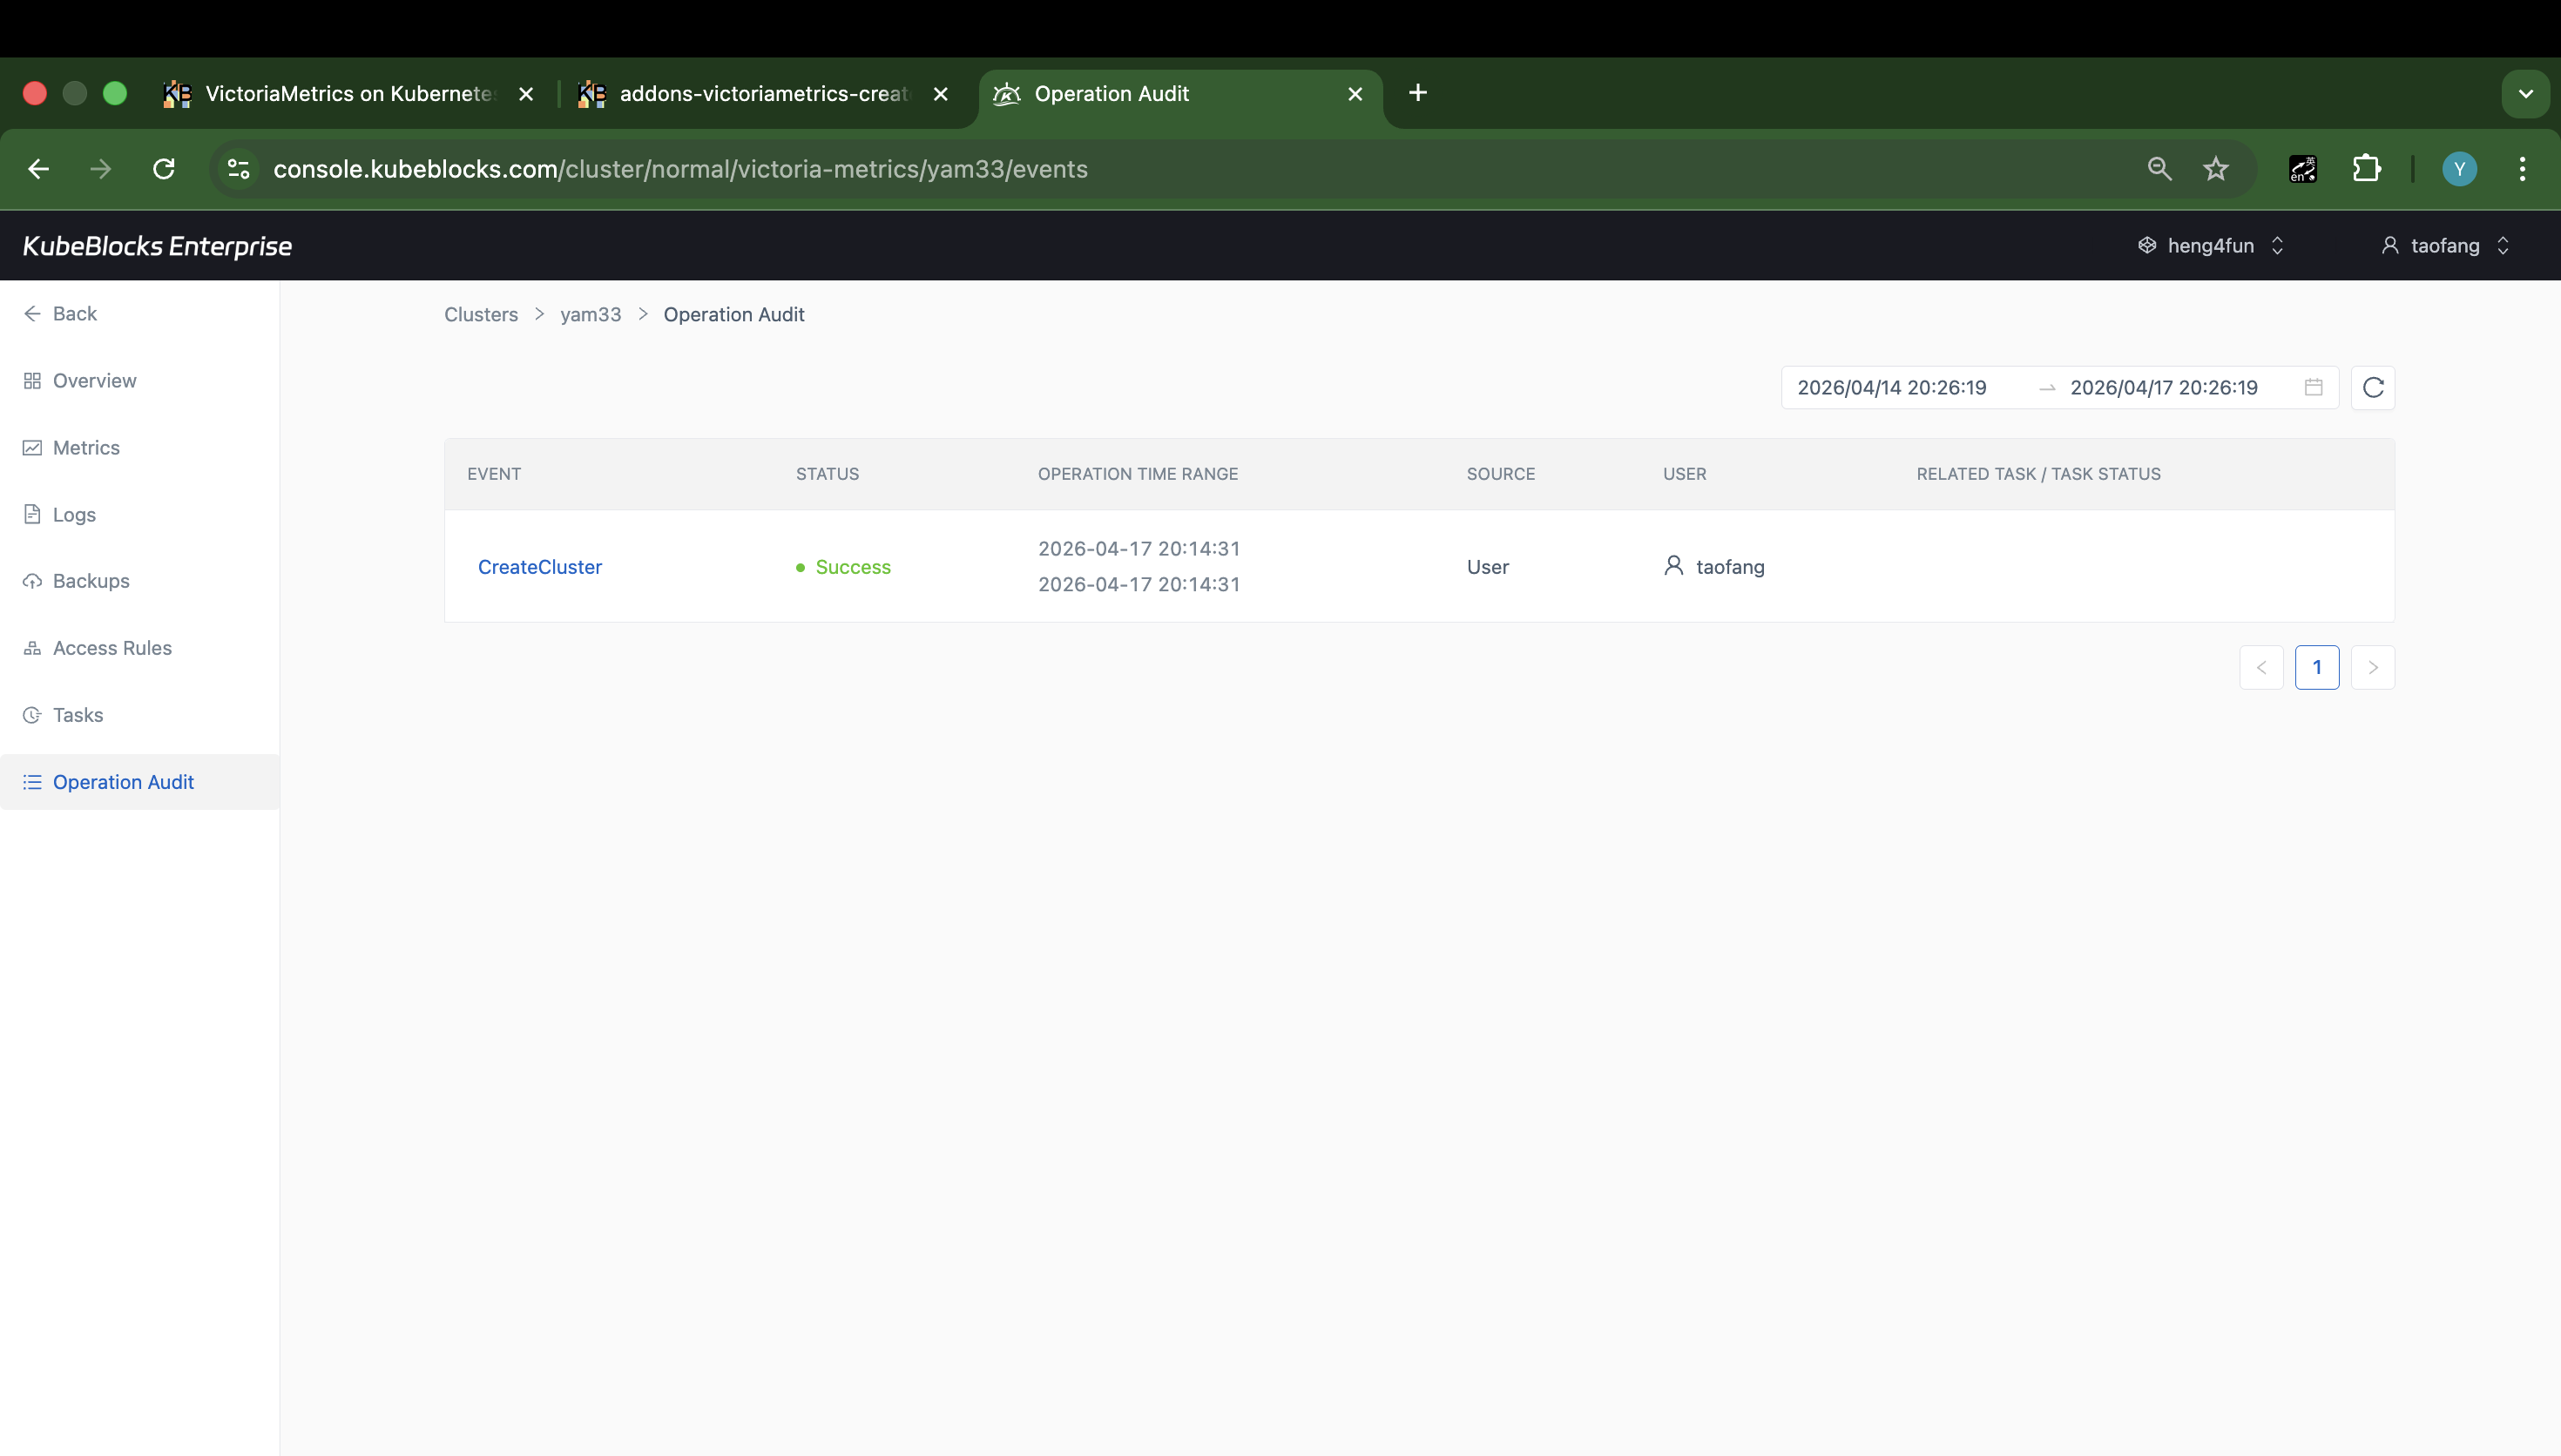
Task history gives teams a practical event trail for VictoriaMetrics provisioning and change review.
Trace VictoriaMetrics operations from task history
Task history records cluster events so teams can review who initiated a VictoriaMetrics operation, when it ran, and whether it completed successfully before handing the service back to users.
- Review the event type, status, operation time, source, and user from one task timeline.
- Keep change review visible even when the Tasks page does not yet contain day-2 records for a new cluster.
- Use task history as lightweight evidence for provisioning and change handoff.
Ready to build your own DBaaS on Kubernetes?
Talk to our team and see how KubeBlocks Enterprise can help you consolidate databases, strengthen security, and reduce operational costs.