
KubeBlocks for
RabbitMQ
RabbitMQ is the most widely deployed open-source message broker. It supports multiple messaging protocols including AMQP, MQTT, and STOMP, enabling reliable asynchronous communication, task queues, and pub/sub patterns across distributed systems.
Supported versions
Available on
 AWS
AWS Azure
Azure GCP
GCP OCI
OCI Alibaba Cloud
 Rancher
 OpenShift
Databases
 MySQL
MySQL PostgreSQLOracle
 SQL Server
 Redis
Redis MongoDB
 ClickHouse
Vector & AI
 Qdrant
 Milvus
 Elasticsearch
Message queues
 RocketMQ
 RabbitMQ
 Kafka
KafkaOthers
 VictoriaMetrics
 InfluxDB
 etcd
etcd ZooKeeper
Extend database engines like plug-ins
KubeBlocks provides unified database operations through its addon-based architecture. With KubeBlocks Enterprise, access over 15 seamless integrations to scale your database services.
One control plane, consistent operations across all engines — powered by the addon mechanism.
Run RabbitMQ with real lifecycle, clustered availability, scaling, and management workflows
Operate RabbitMQ with a guided create wizard, running cluster topology, compute and storage scaling, parameter review, metrics, logs, IP whitelist controls, task history, and a public management-console workflow backed by real KubeBlocks Enterprise screens.
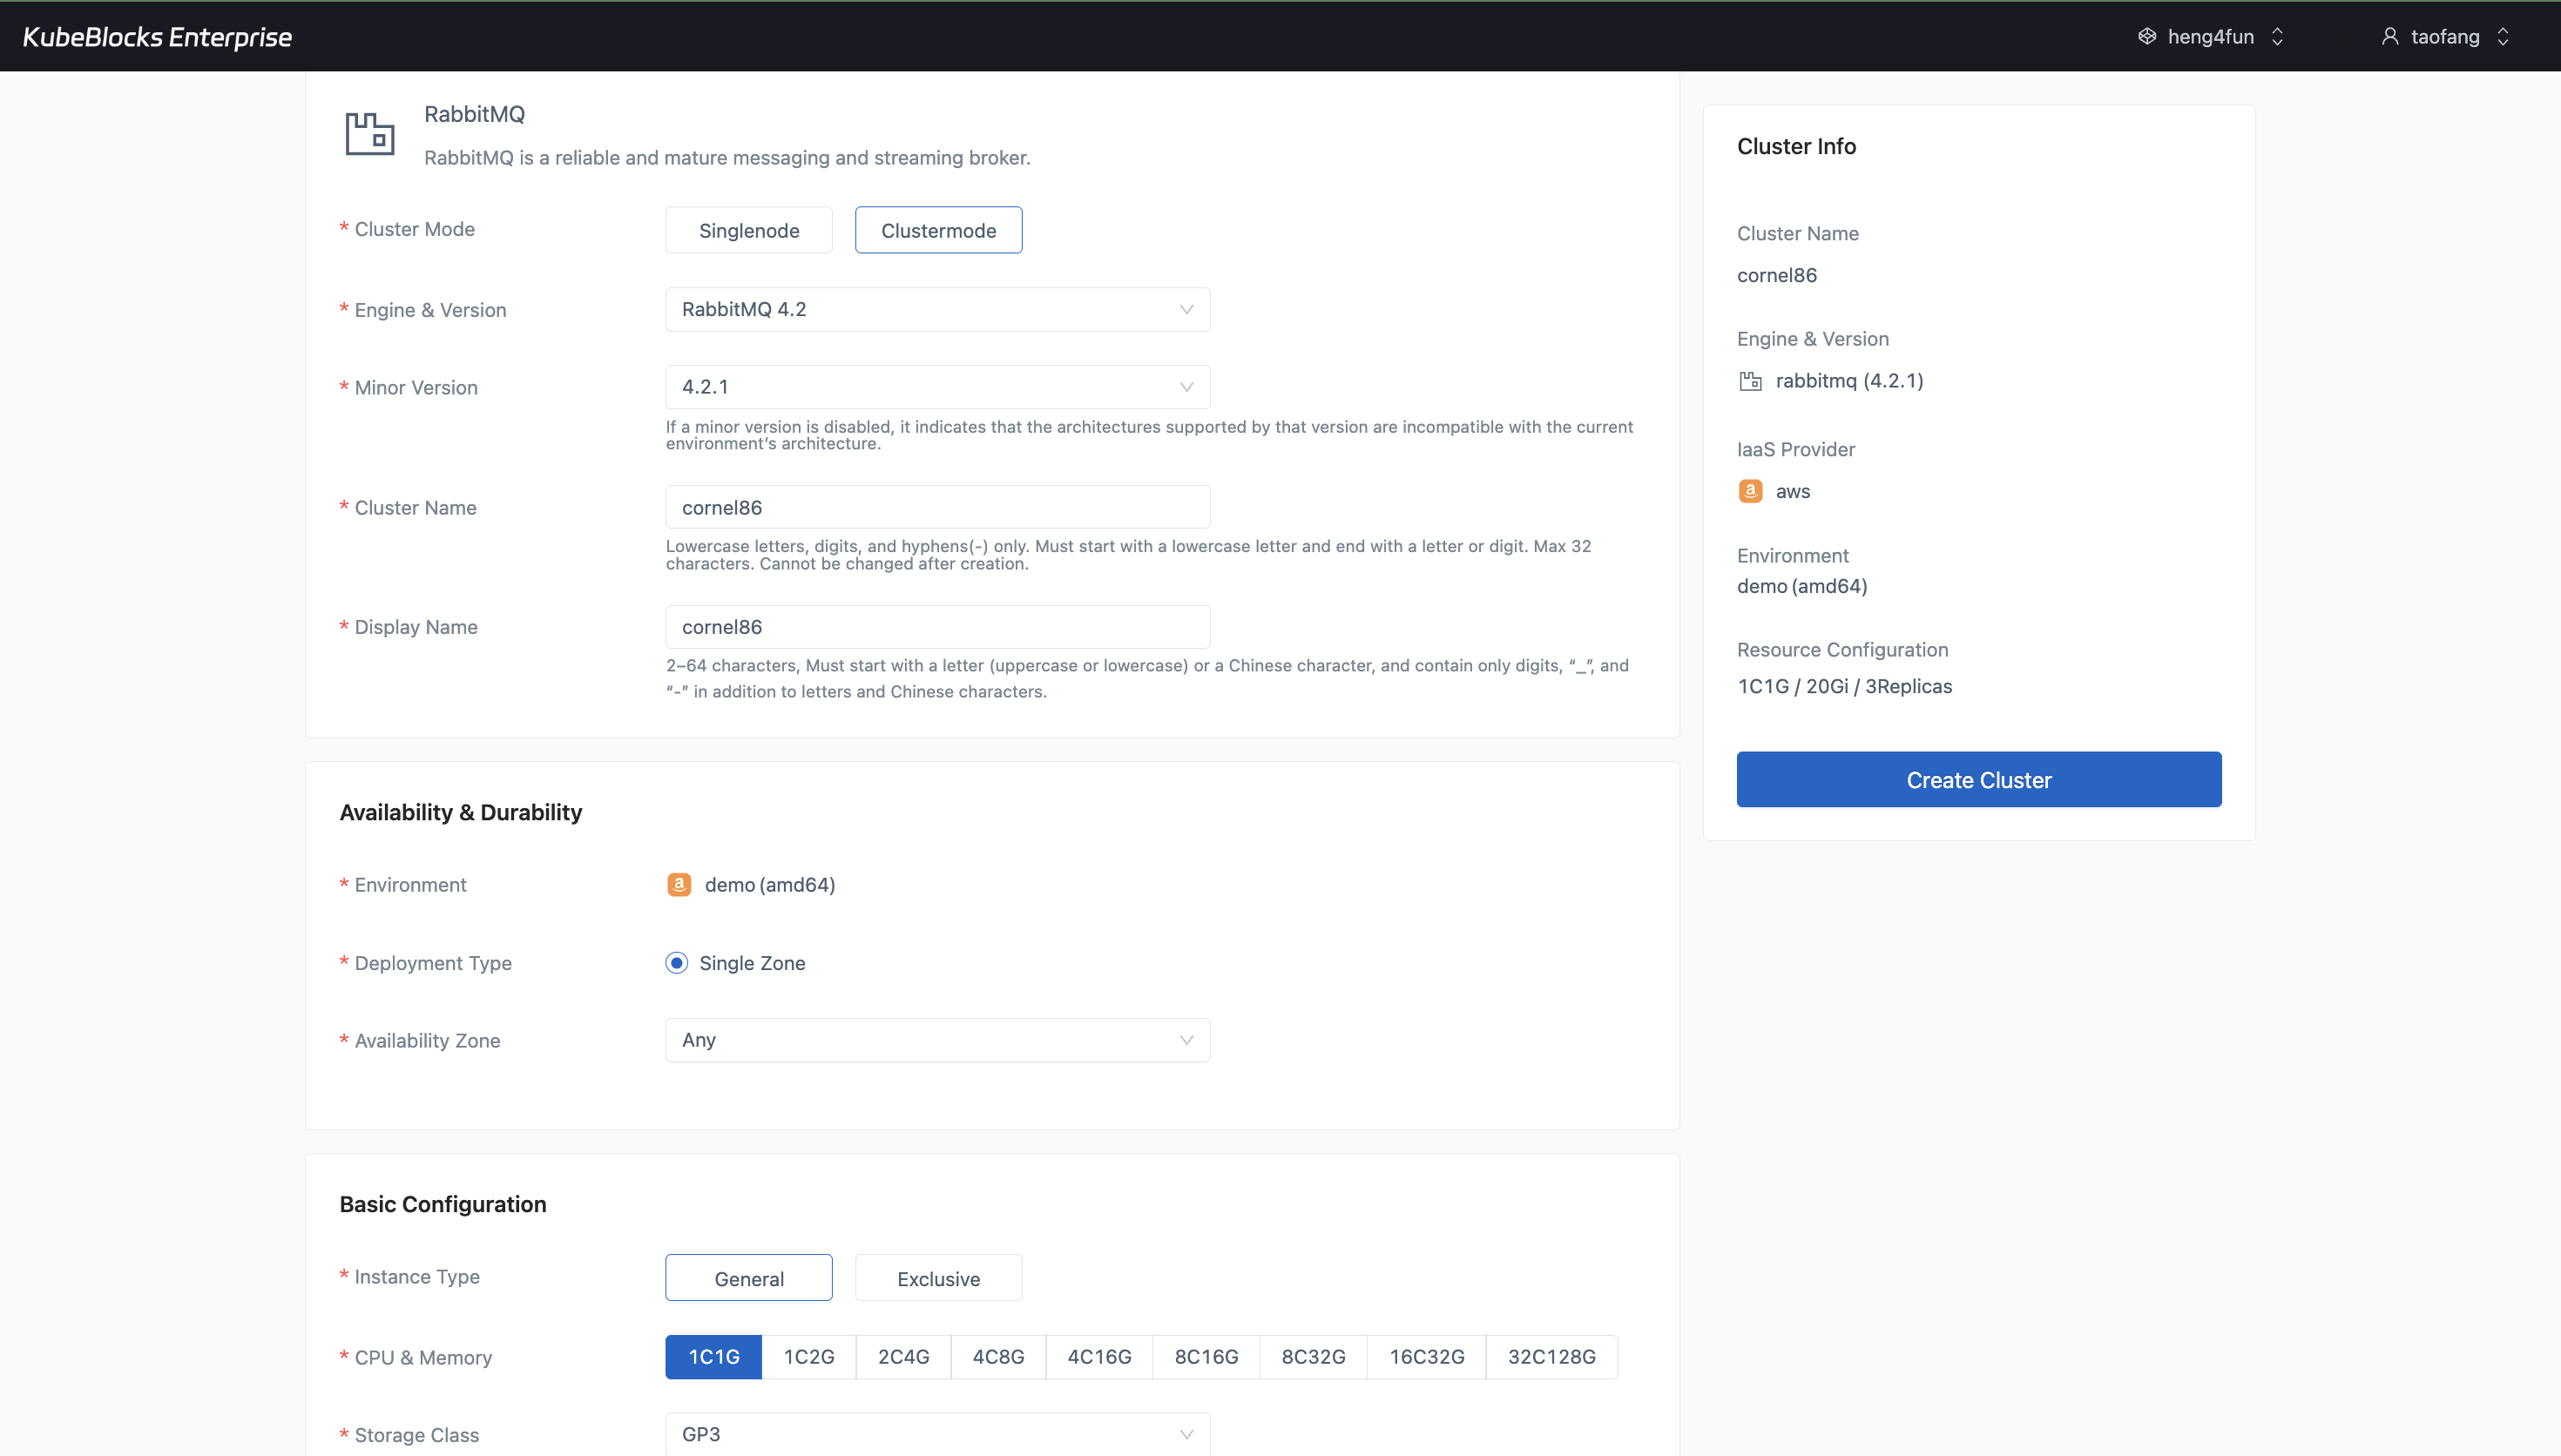
The create wizard keeps RabbitMQ topology, version, compute, storage, and replica choices visible before users create the cluster.
Create RabbitMQ clusters with topology, version, and storage choices
Launch RabbitMQ from a guided create wizard that keeps cluster mode, engine version, minor version, compute, storage, replicas, maintenance window, and project settings visible before users create the cluster.
- Choose the clustered deployment, RabbitMQ 4.2.1, CPU and memory, storage class, storage size, and replica count in one flow.
- Review the final cluster summary before creation instead of piecing configuration details together later.
- Keep day-2 operations in the same cluster workspace after the initial rollout finishes.
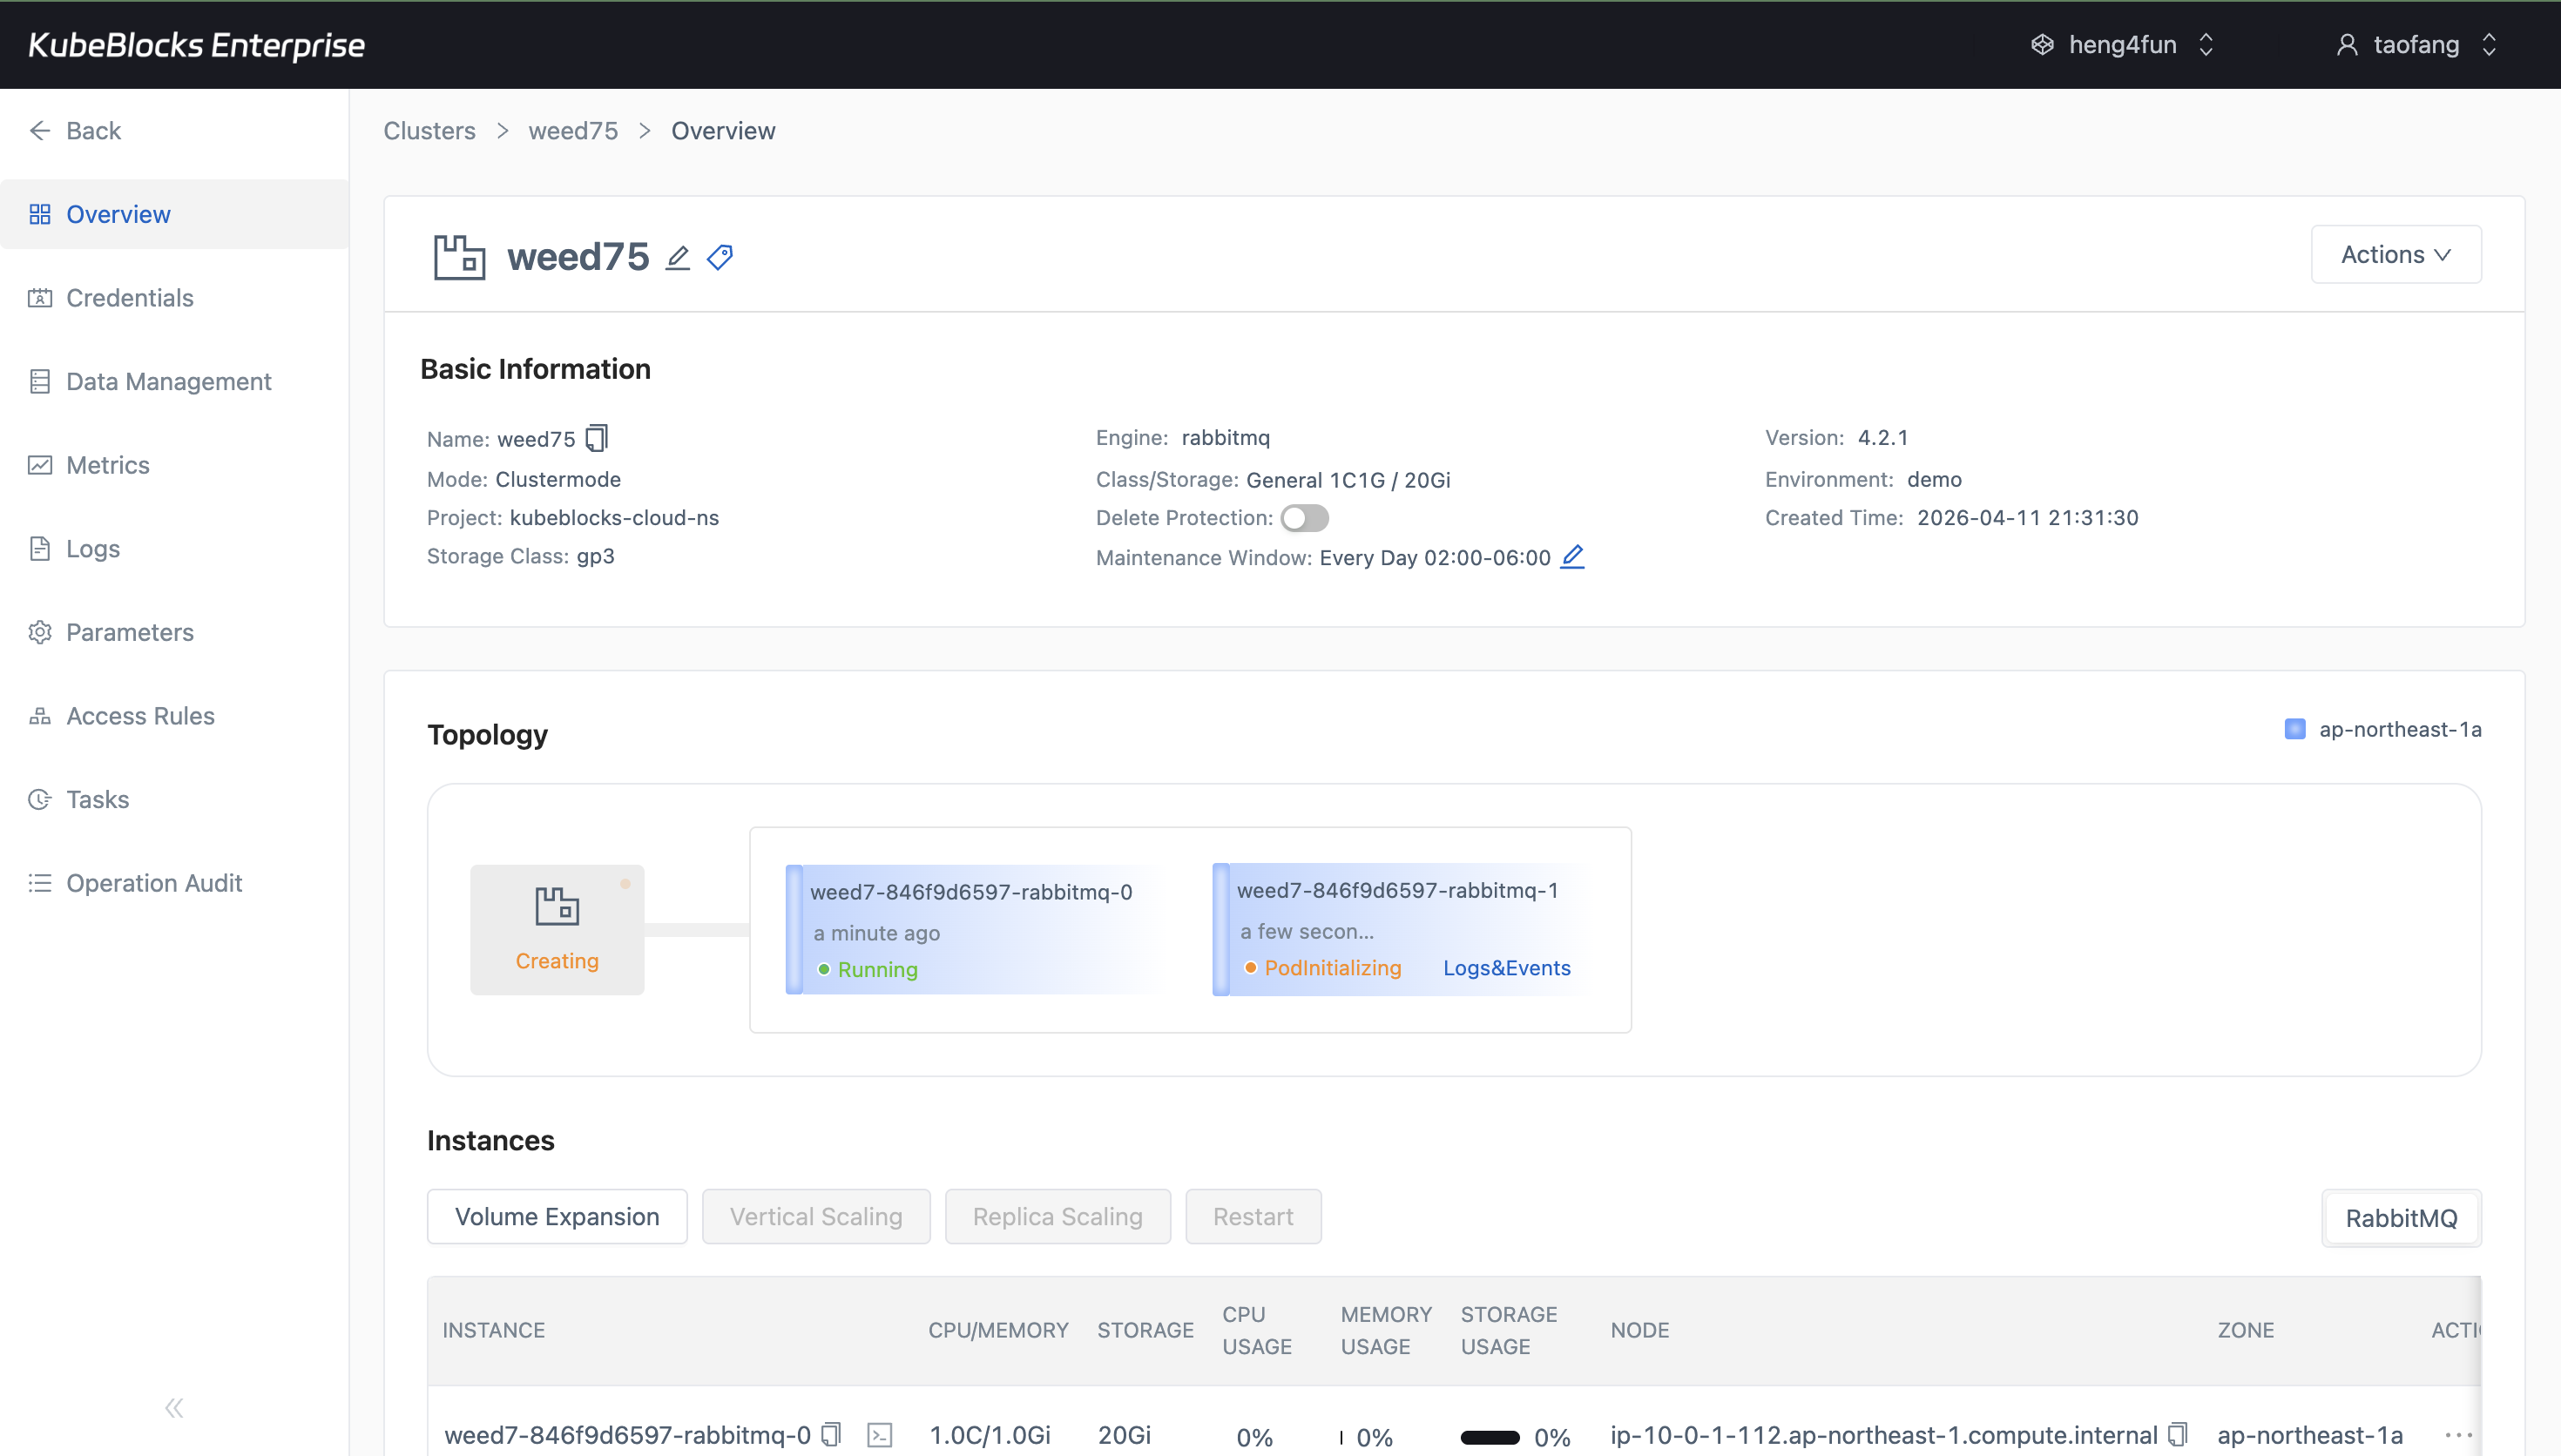
The overview keeps every RabbitMQ cluster member visible so users can confirm the running topology at a glance.
Keep clustered RabbitMQ members visible from the running topology
The tested RabbitMQ cluster runs with three members, and the overview keeps every member state visible from one topology view. In this version, the console did not surface a separate planned switchover action for RabbitMQ.
- Review each RabbitMQ member and its running status from the clustered topology view.
- Track node age and topology placement without leaving the overview page.
- Use the captured topology as the deepest validated high-availability evidence when no dedicated switchover entry is exposed.
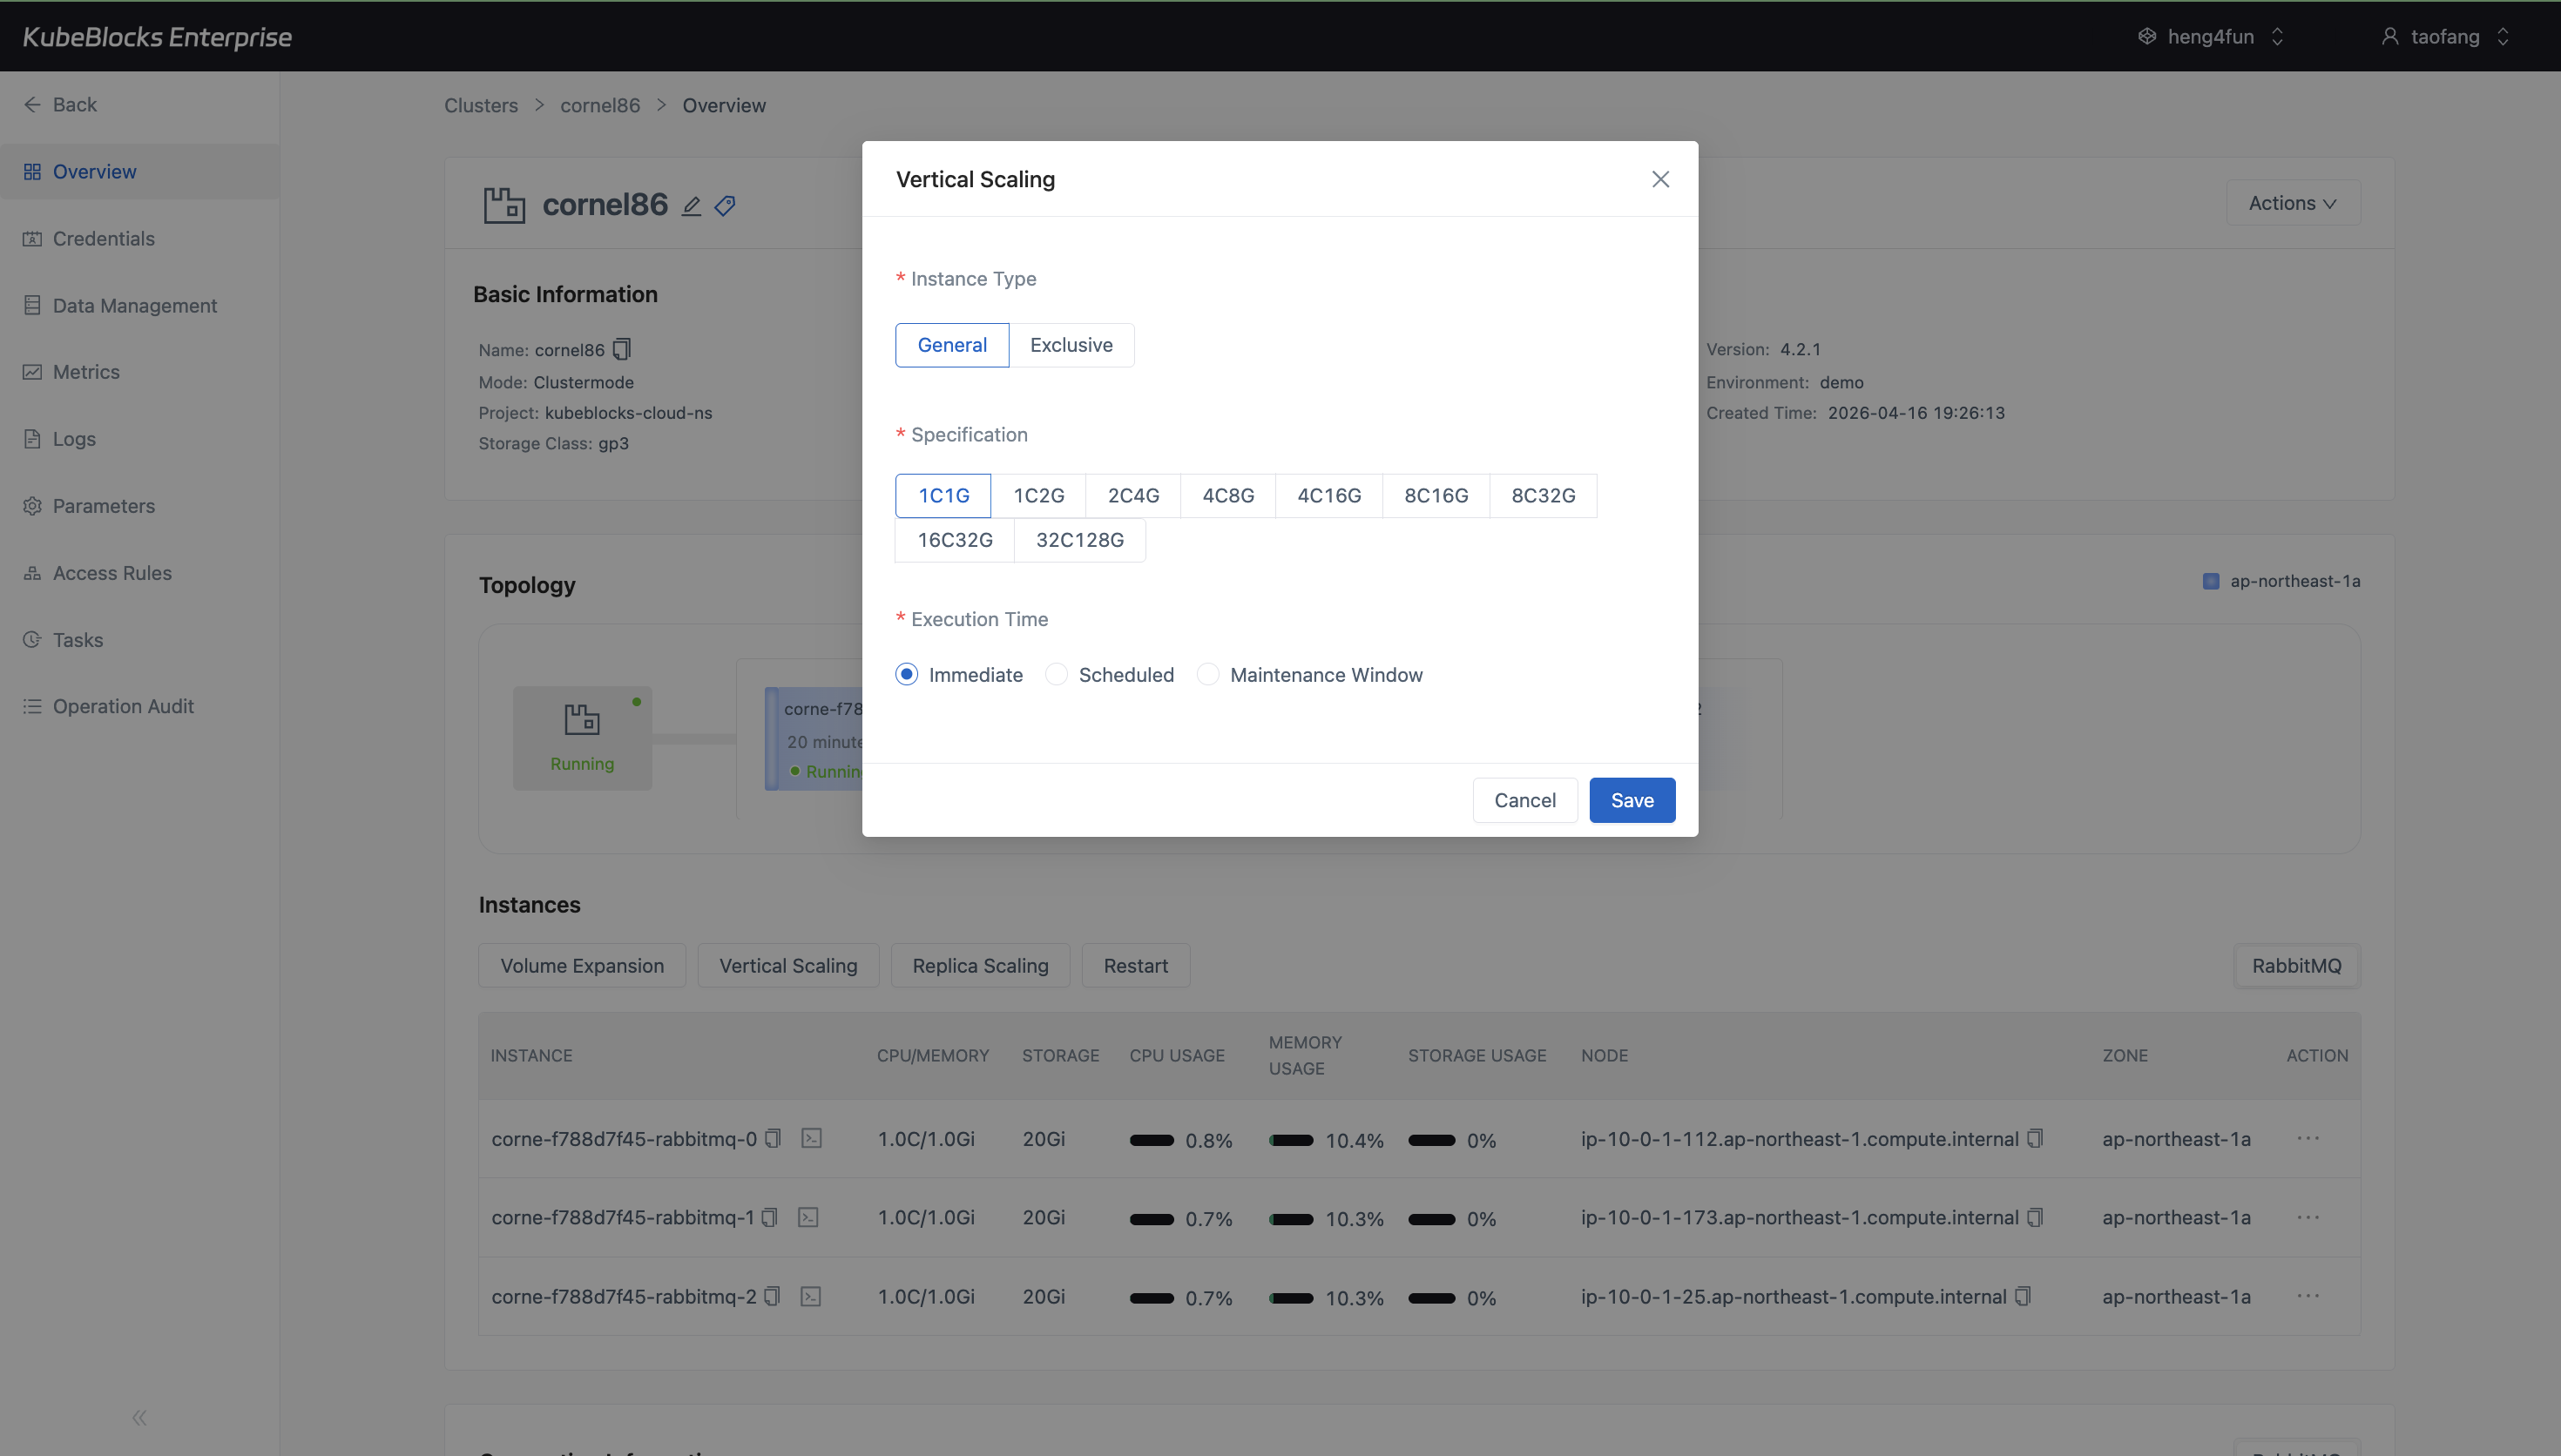
Vertical Scaling keeps RabbitMQ CPU and memory options visible before users save a compute change.
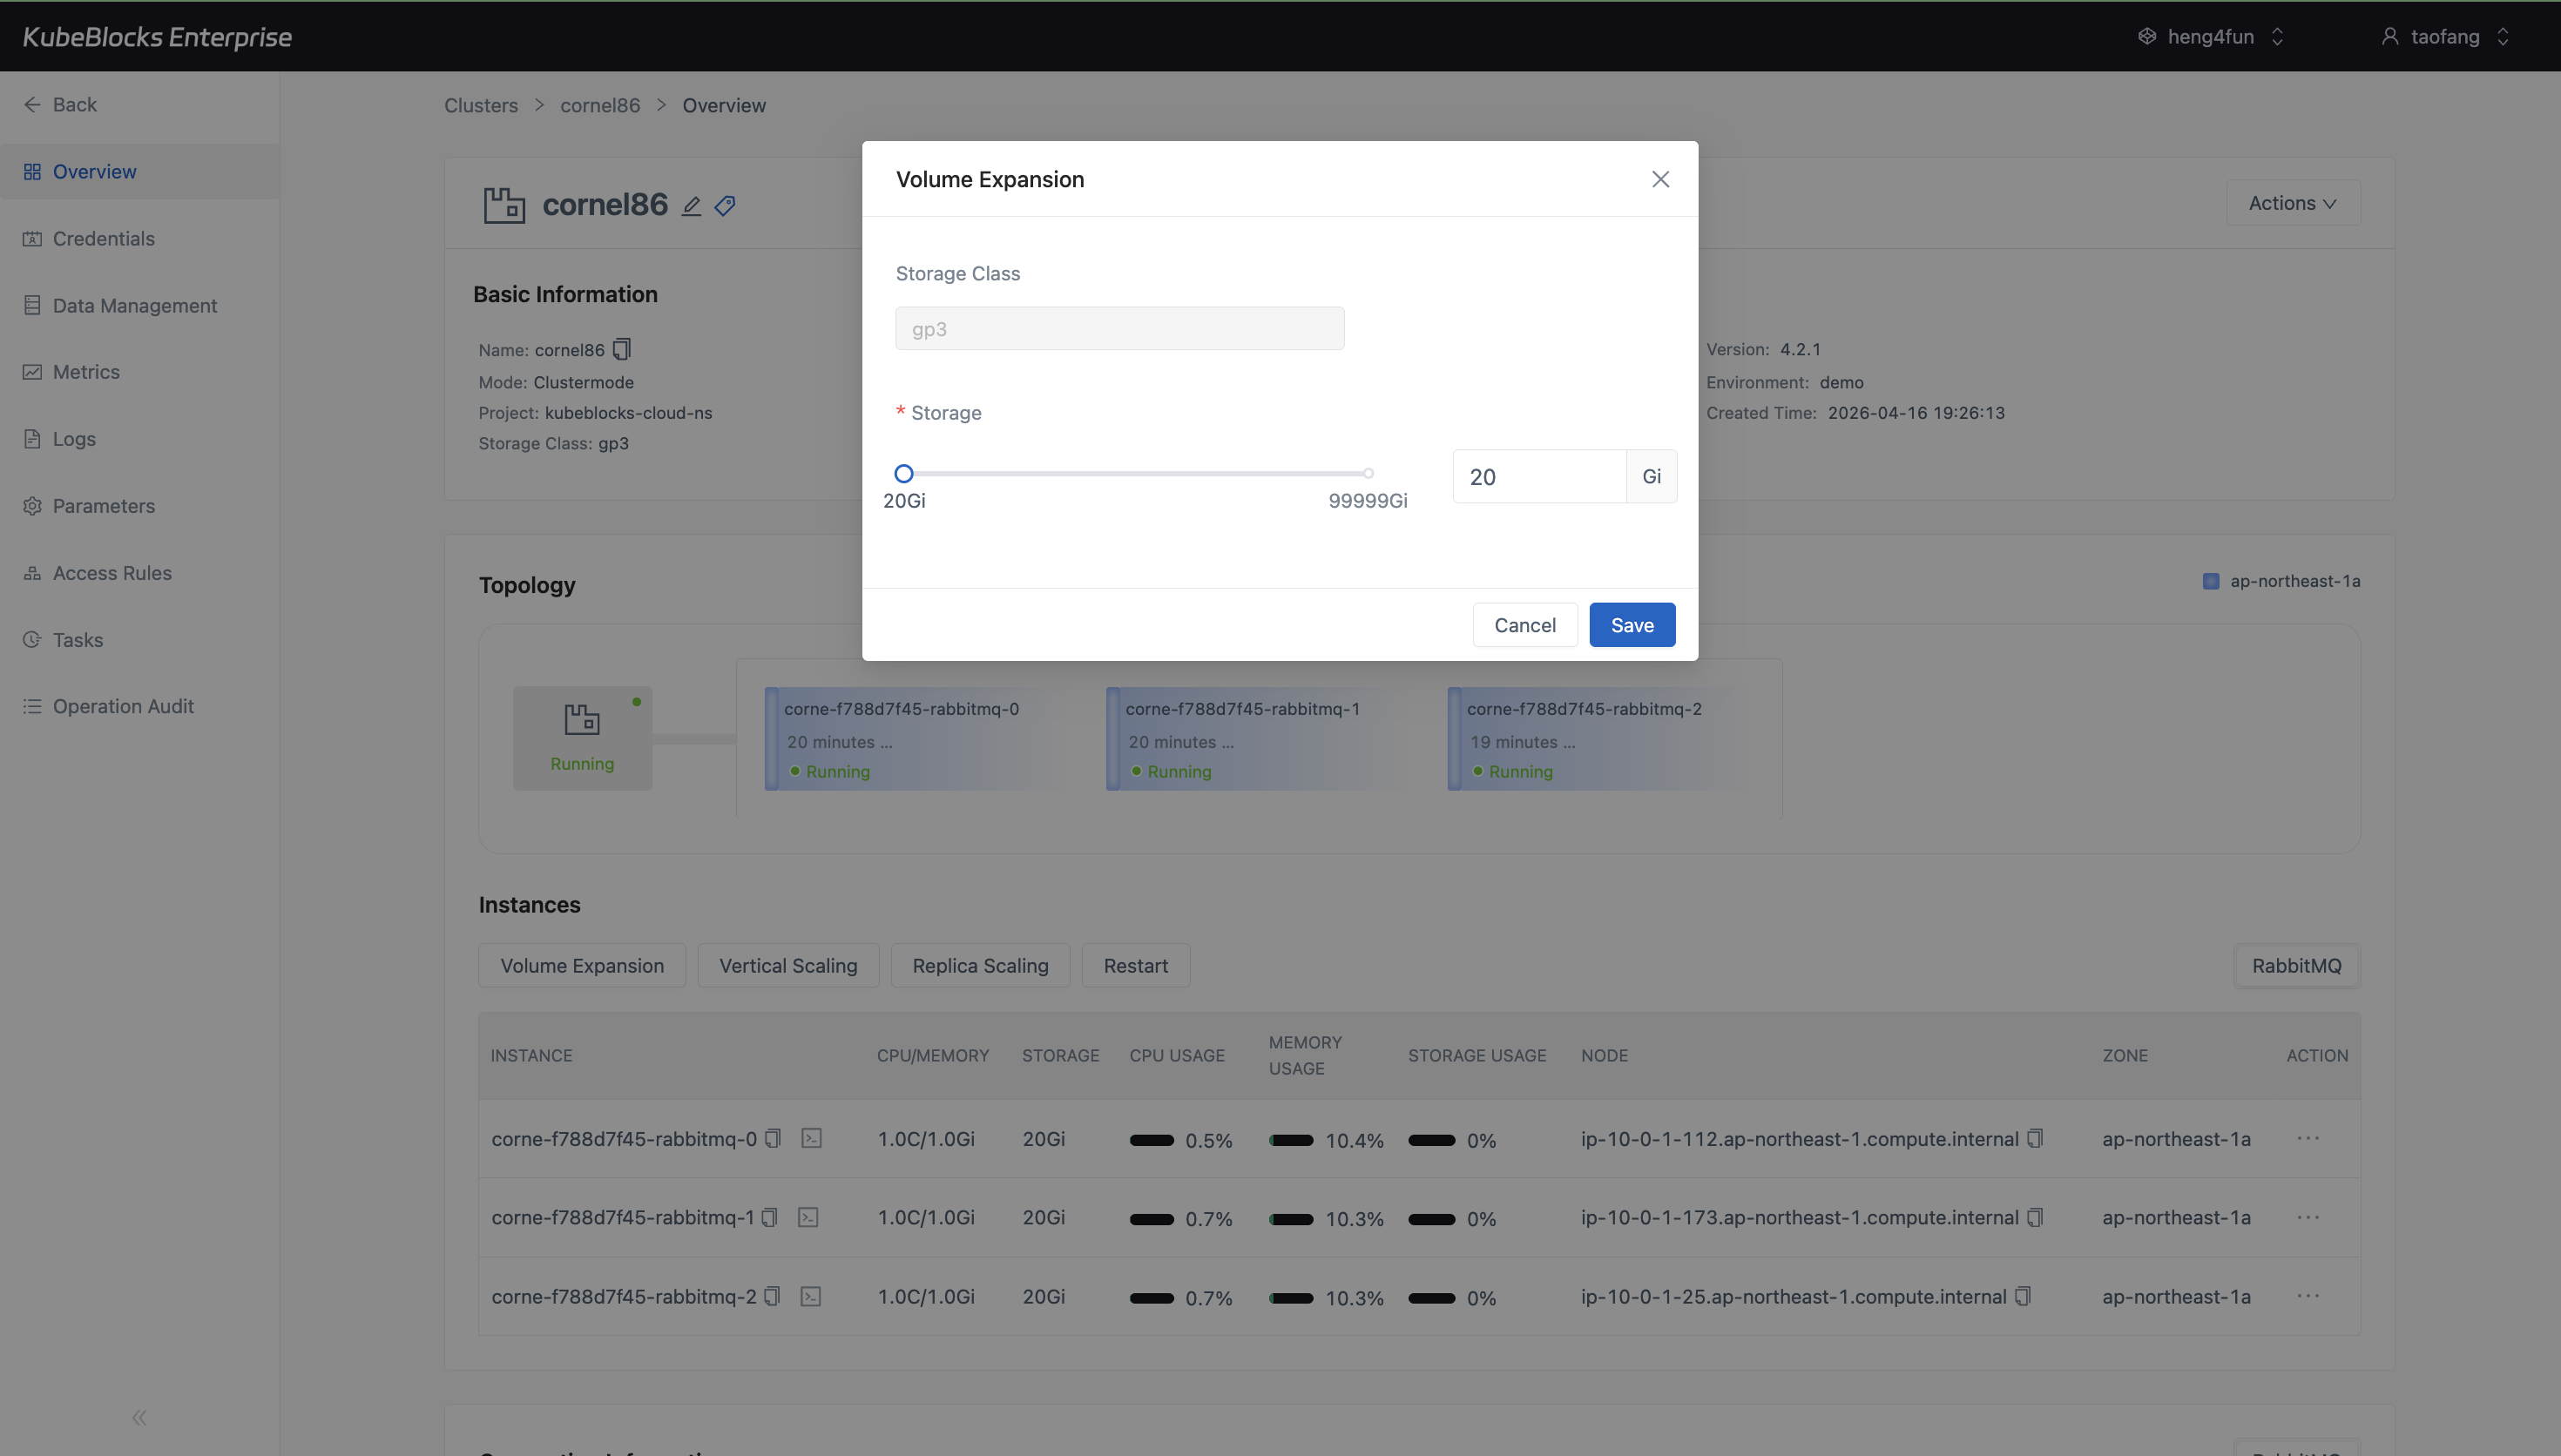
Volume Expansion shows the current RabbitMQ storage size and the target capacity in one dialog.
Resize RabbitMQ compute and storage from operation dialogs
RabbitMQ exposes both Vertical Scaling and Volume Expansion from the cluster workspace so users can review CPU, memory, and storage adjustments before saving them.
- Open Vertical Scaling to compare RabbitMQ instance specifications before applying a compute change.
- Open Volume Expansion to review the storage class, current capacity, and target size from the same operations surface.
- Keep compute and storage growth visible without editing infrastructure objects by hand.
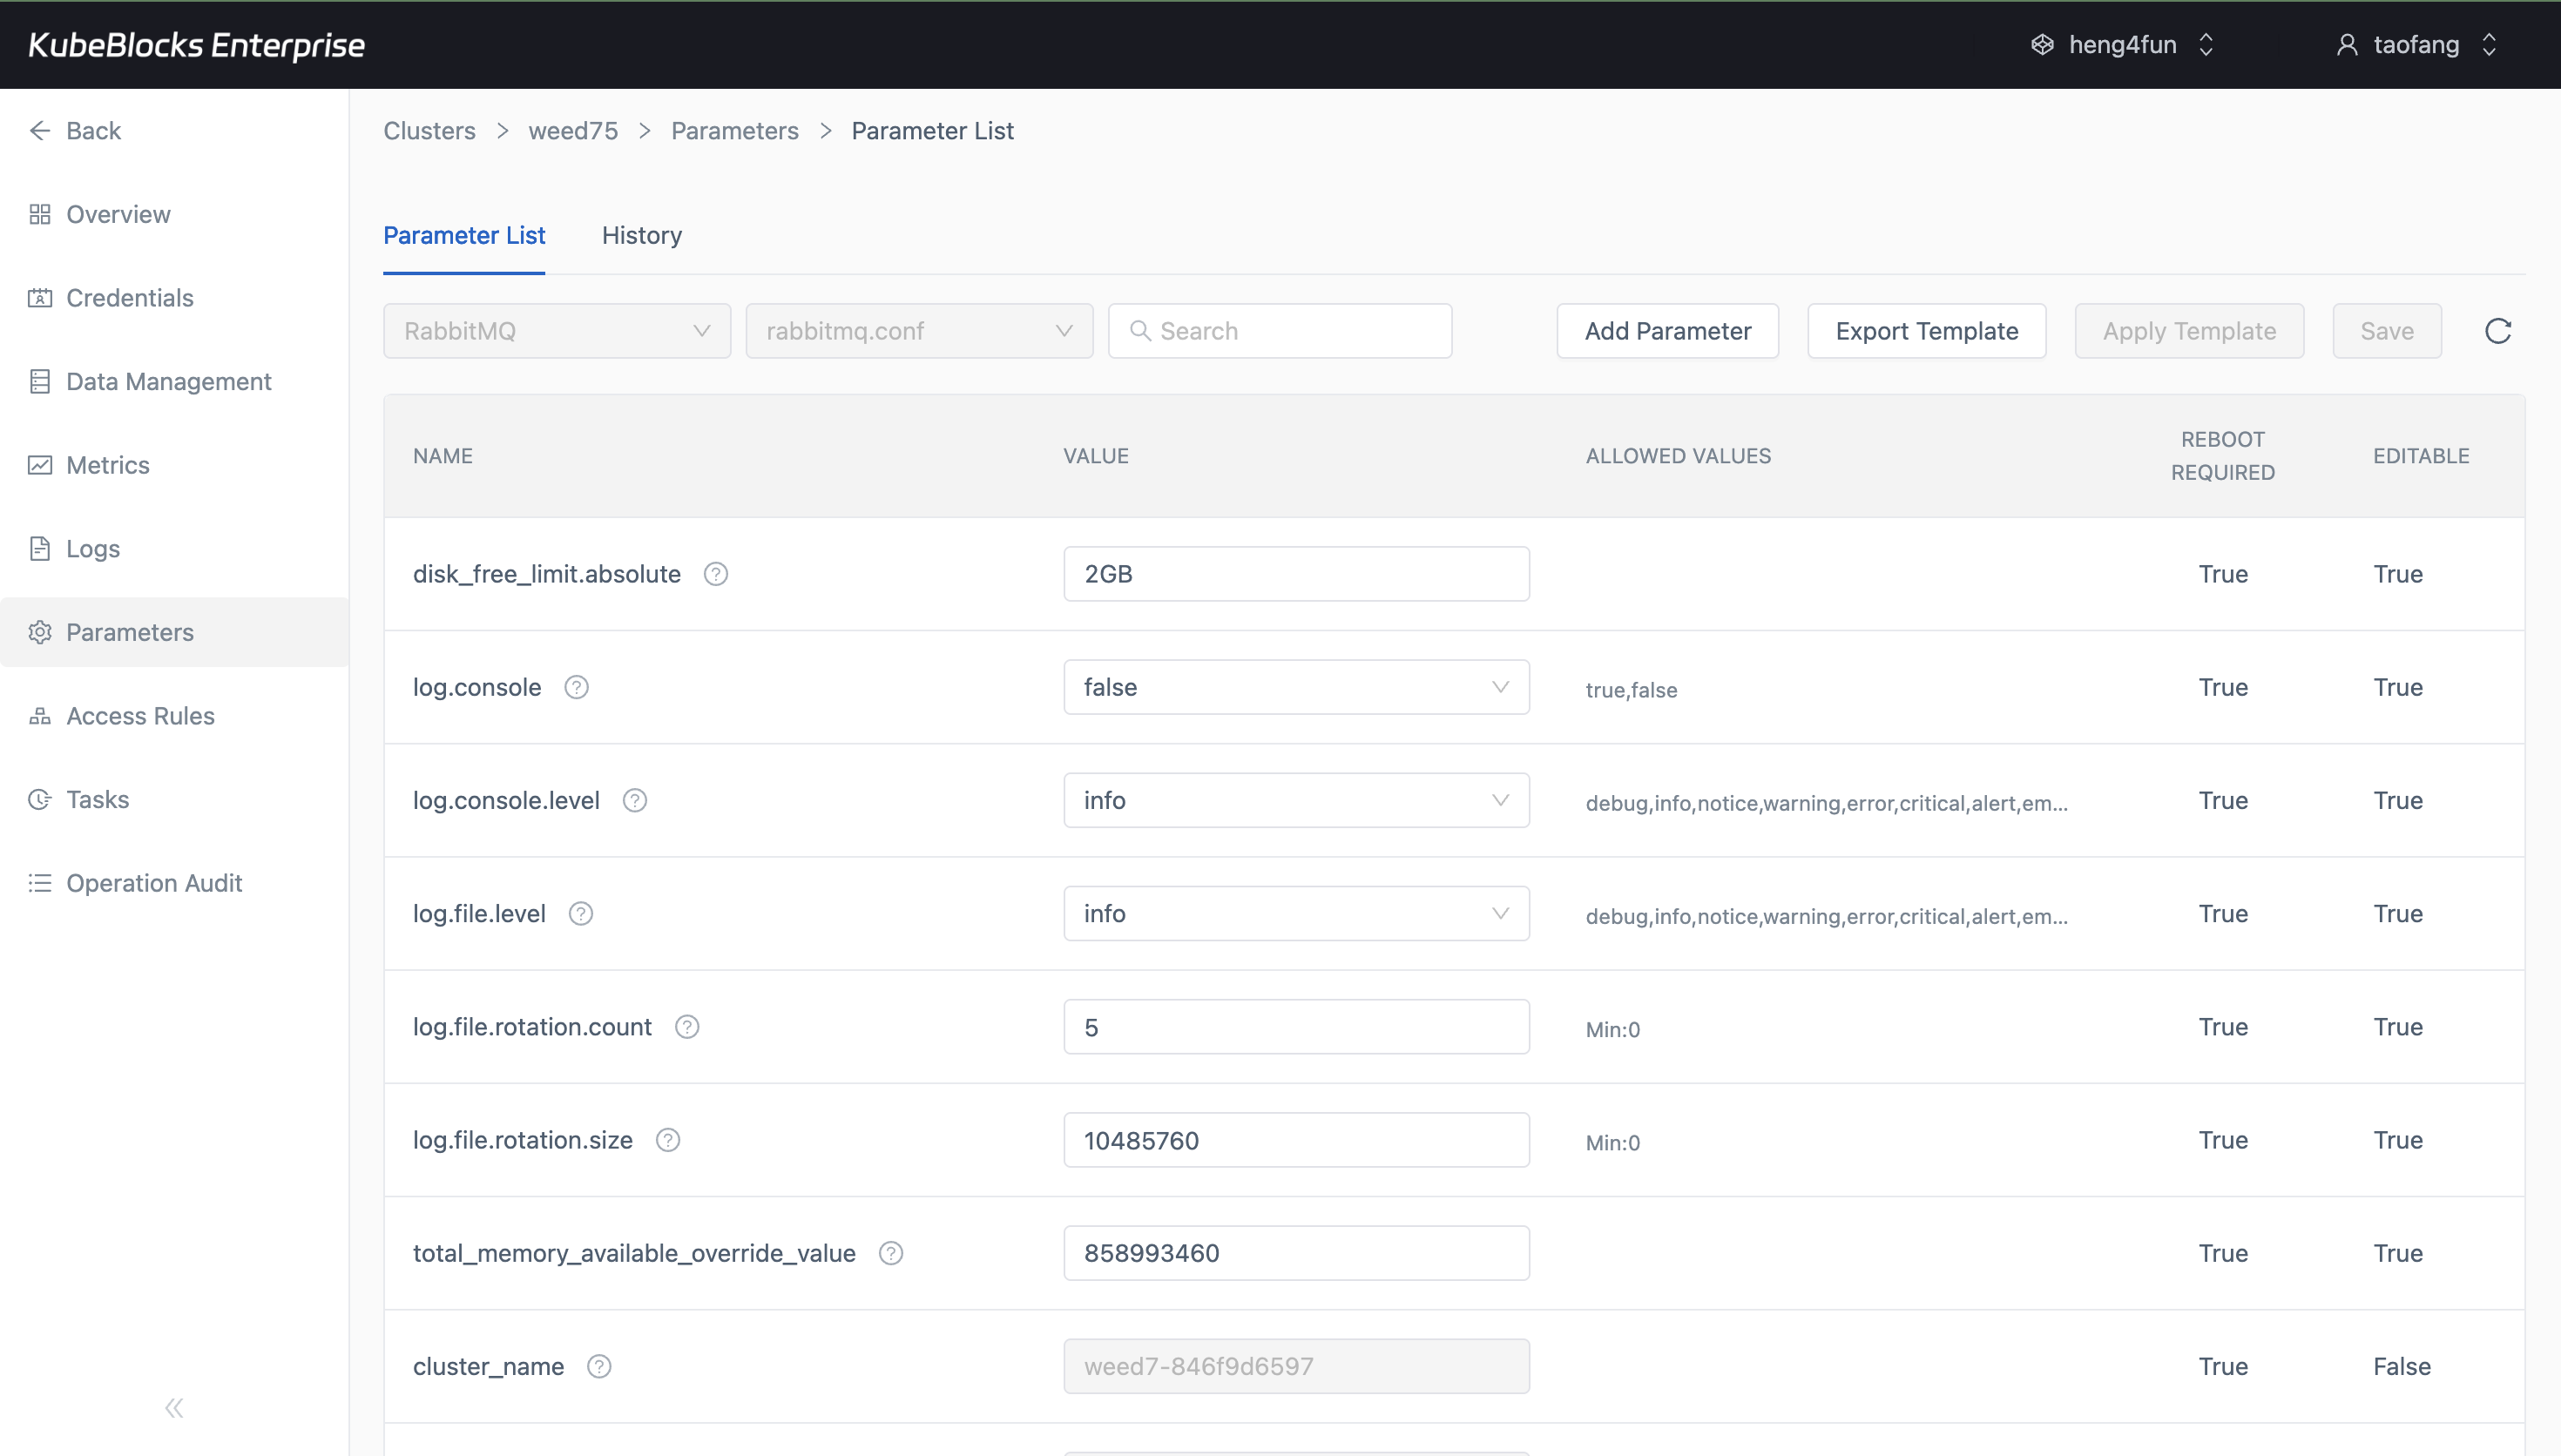
Parameter management helps teams review RabbitMQ settings and understand restart requirements before applying changes.
Review RabbitMQ engine settings before controlled reconfiguration
Use the Parameters workspace to inspect `rabbitmq.conf` values and prepare configuration updates with a clear view of which settings require a restart.
- Inspect RabbitMQ parameter values from a dedicated configuration view.
- Prepare broker behavior changes without leaving the cluster console.
- See reboot-required markers before planning configuration rollout windows.
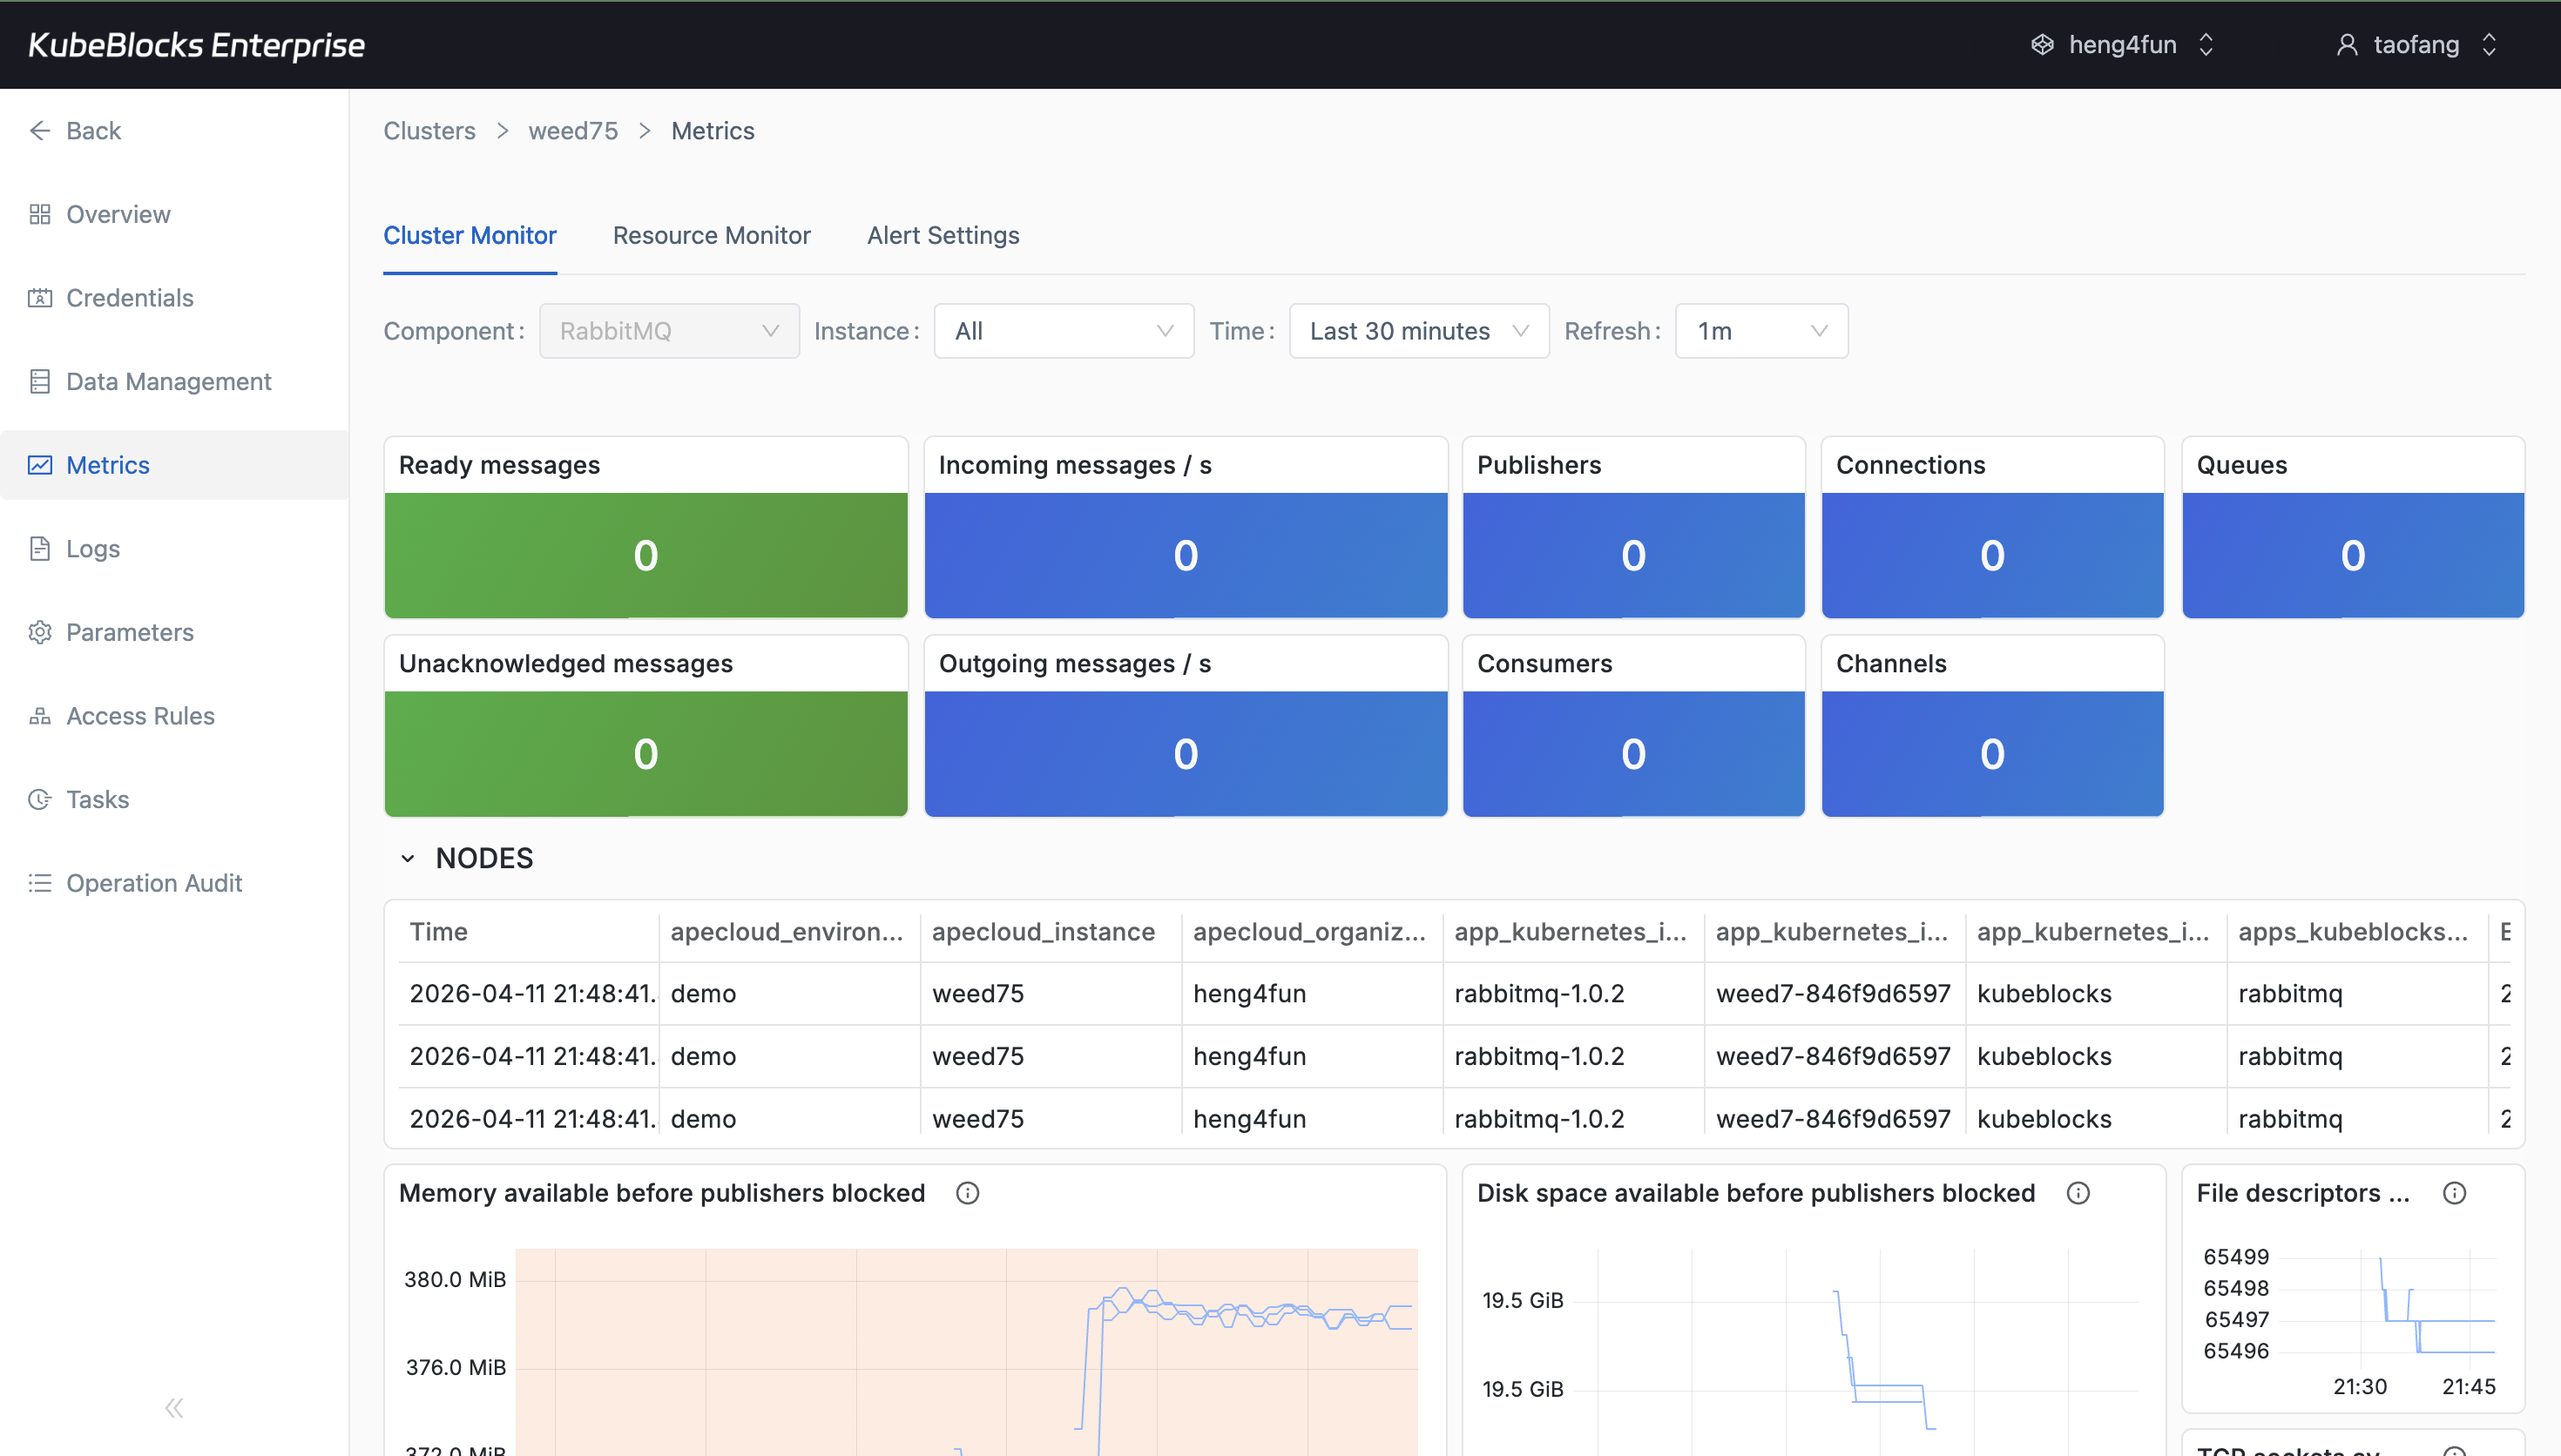
Metrics dashboards give teams a live RabbitMQ health view without leaving the console.
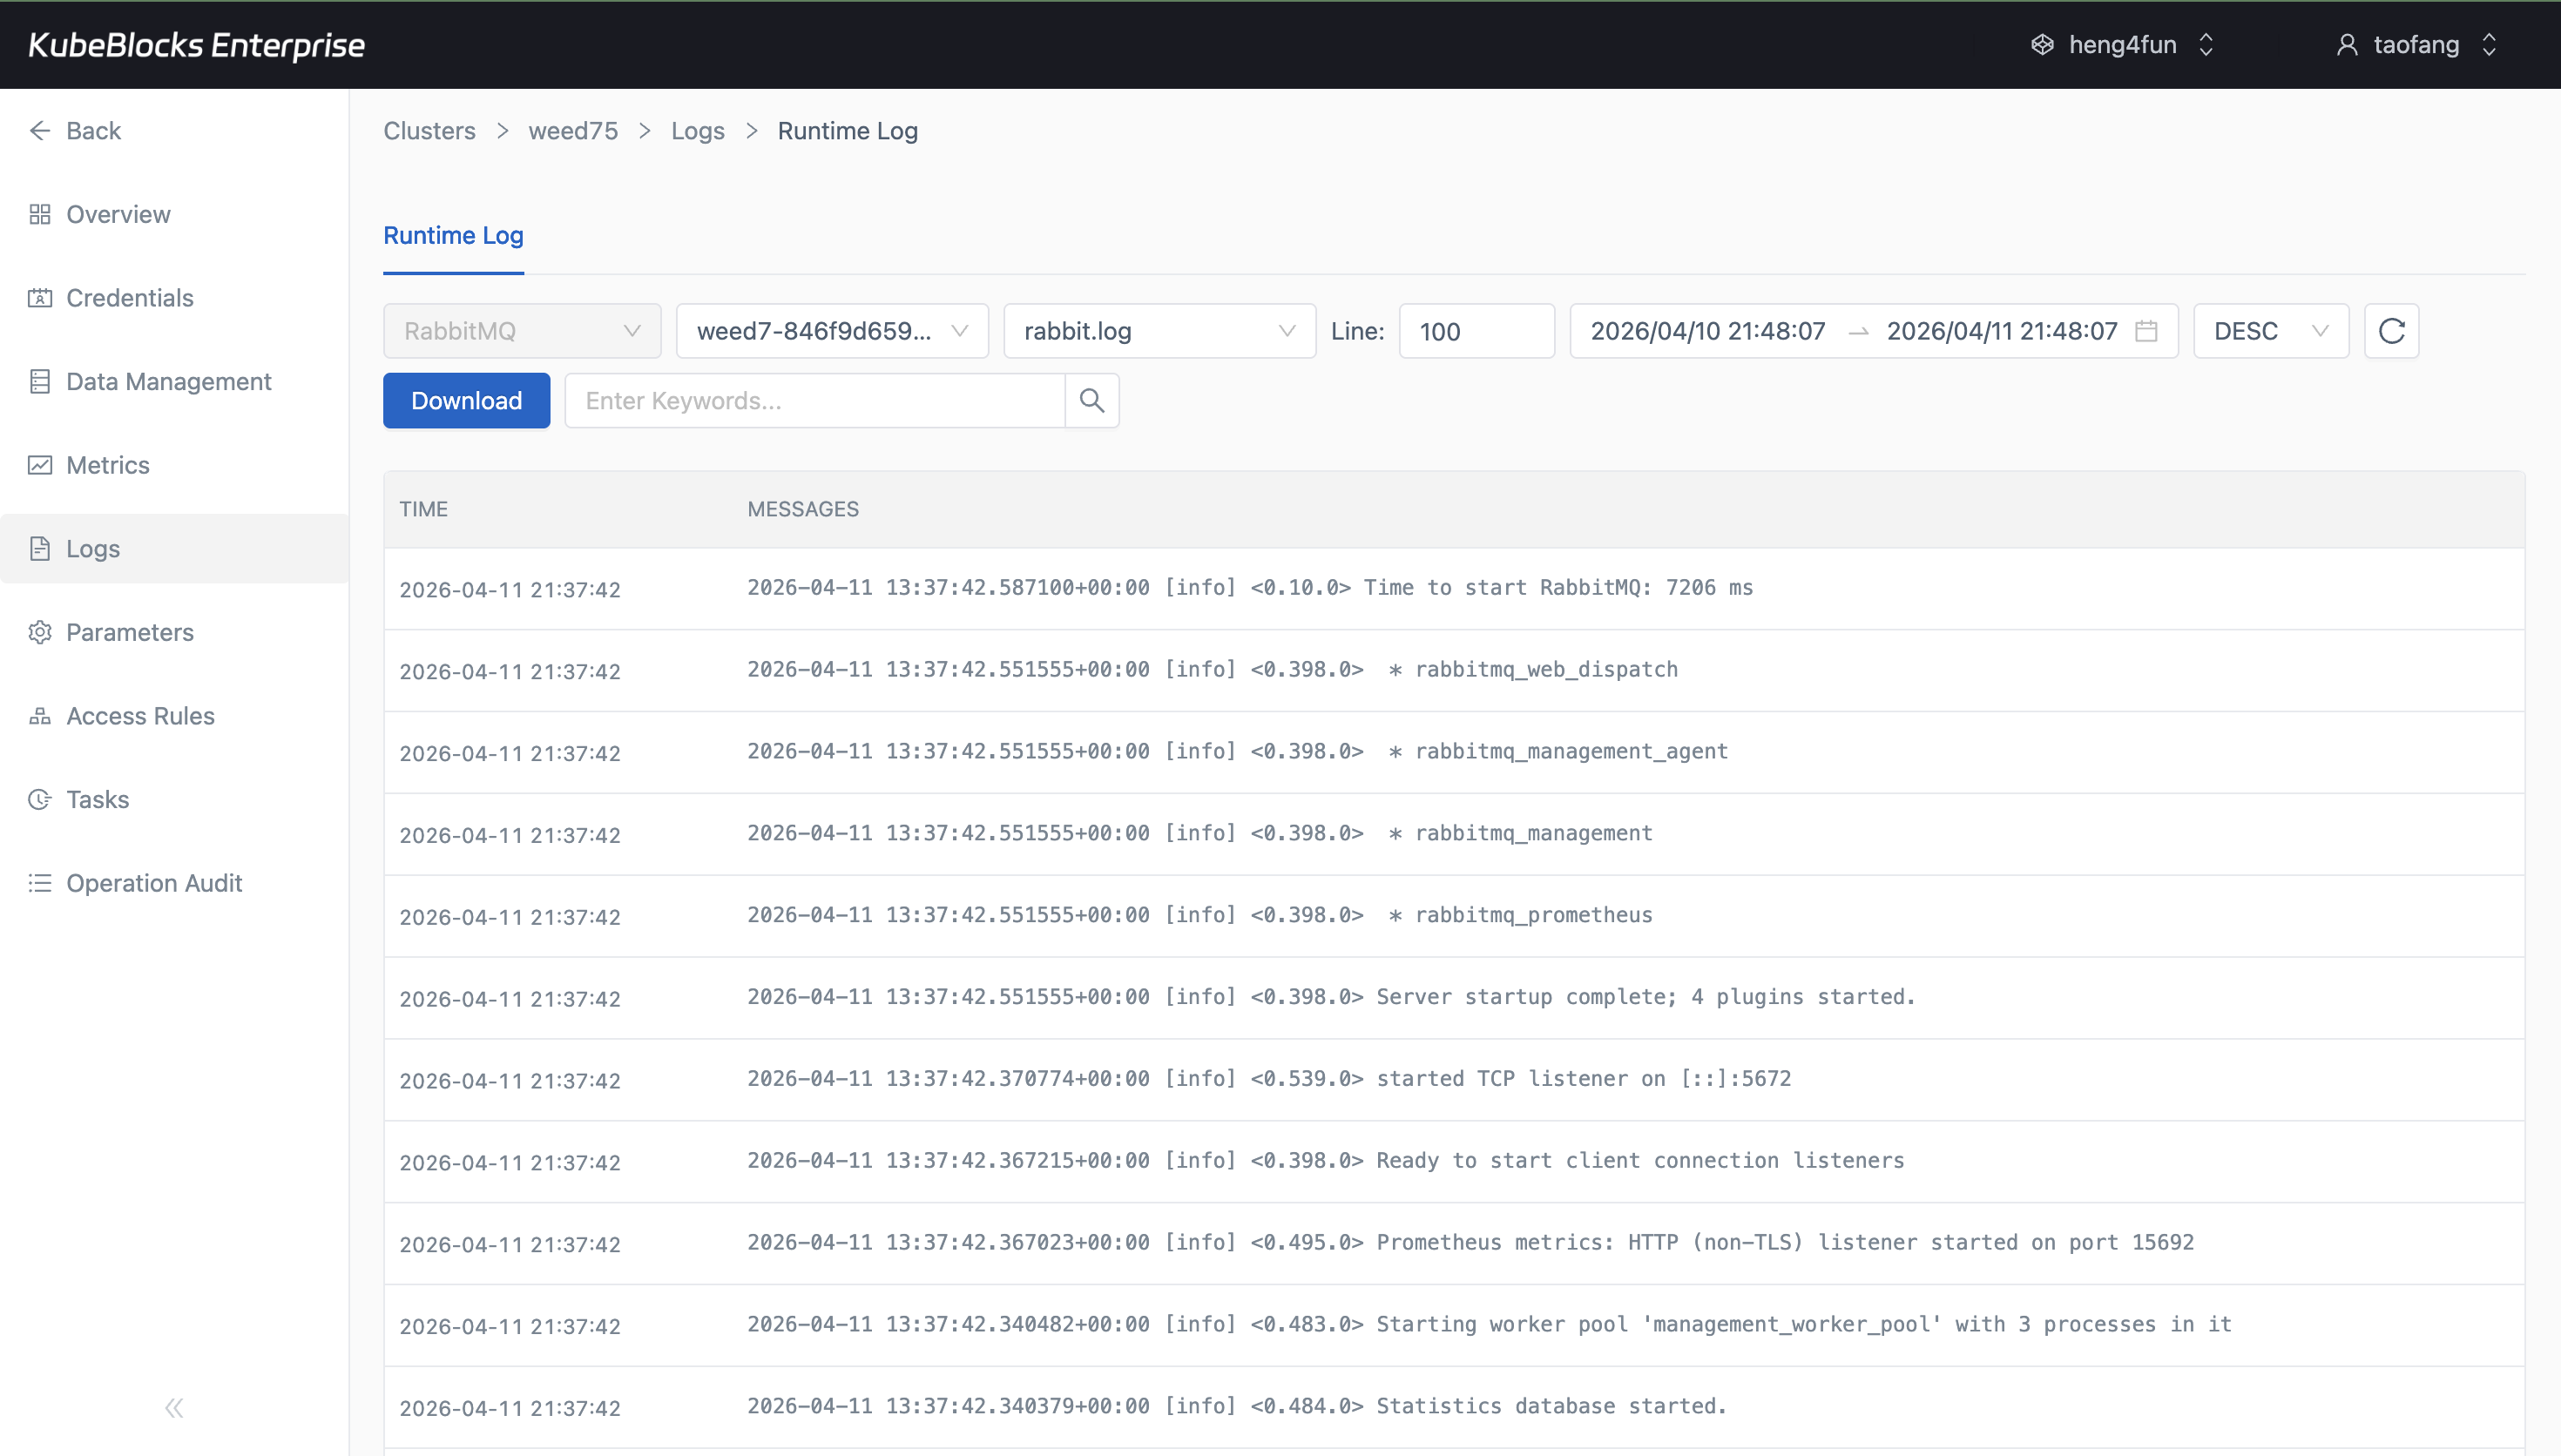
Runtime logs make it easier to verify RabbitMQ listener and management-plugin behavior during troubleshooting.
Monitor RabbitMQ cluster health and inspect runtime behavior
Track cluster health from Cluster Monitor and move into Runtime Log when teams need to understand listener startup, management plugin activity, or broker state transitions.
- Use Cluster Monitor views to watch RabbitMQ health after metrics panels hydrate.
- Inspect real Runtime Log output for listeners, plugins, and broker startup events.
- Keep monitoring and troubleshooting workflows close to the same cluster detail surface.
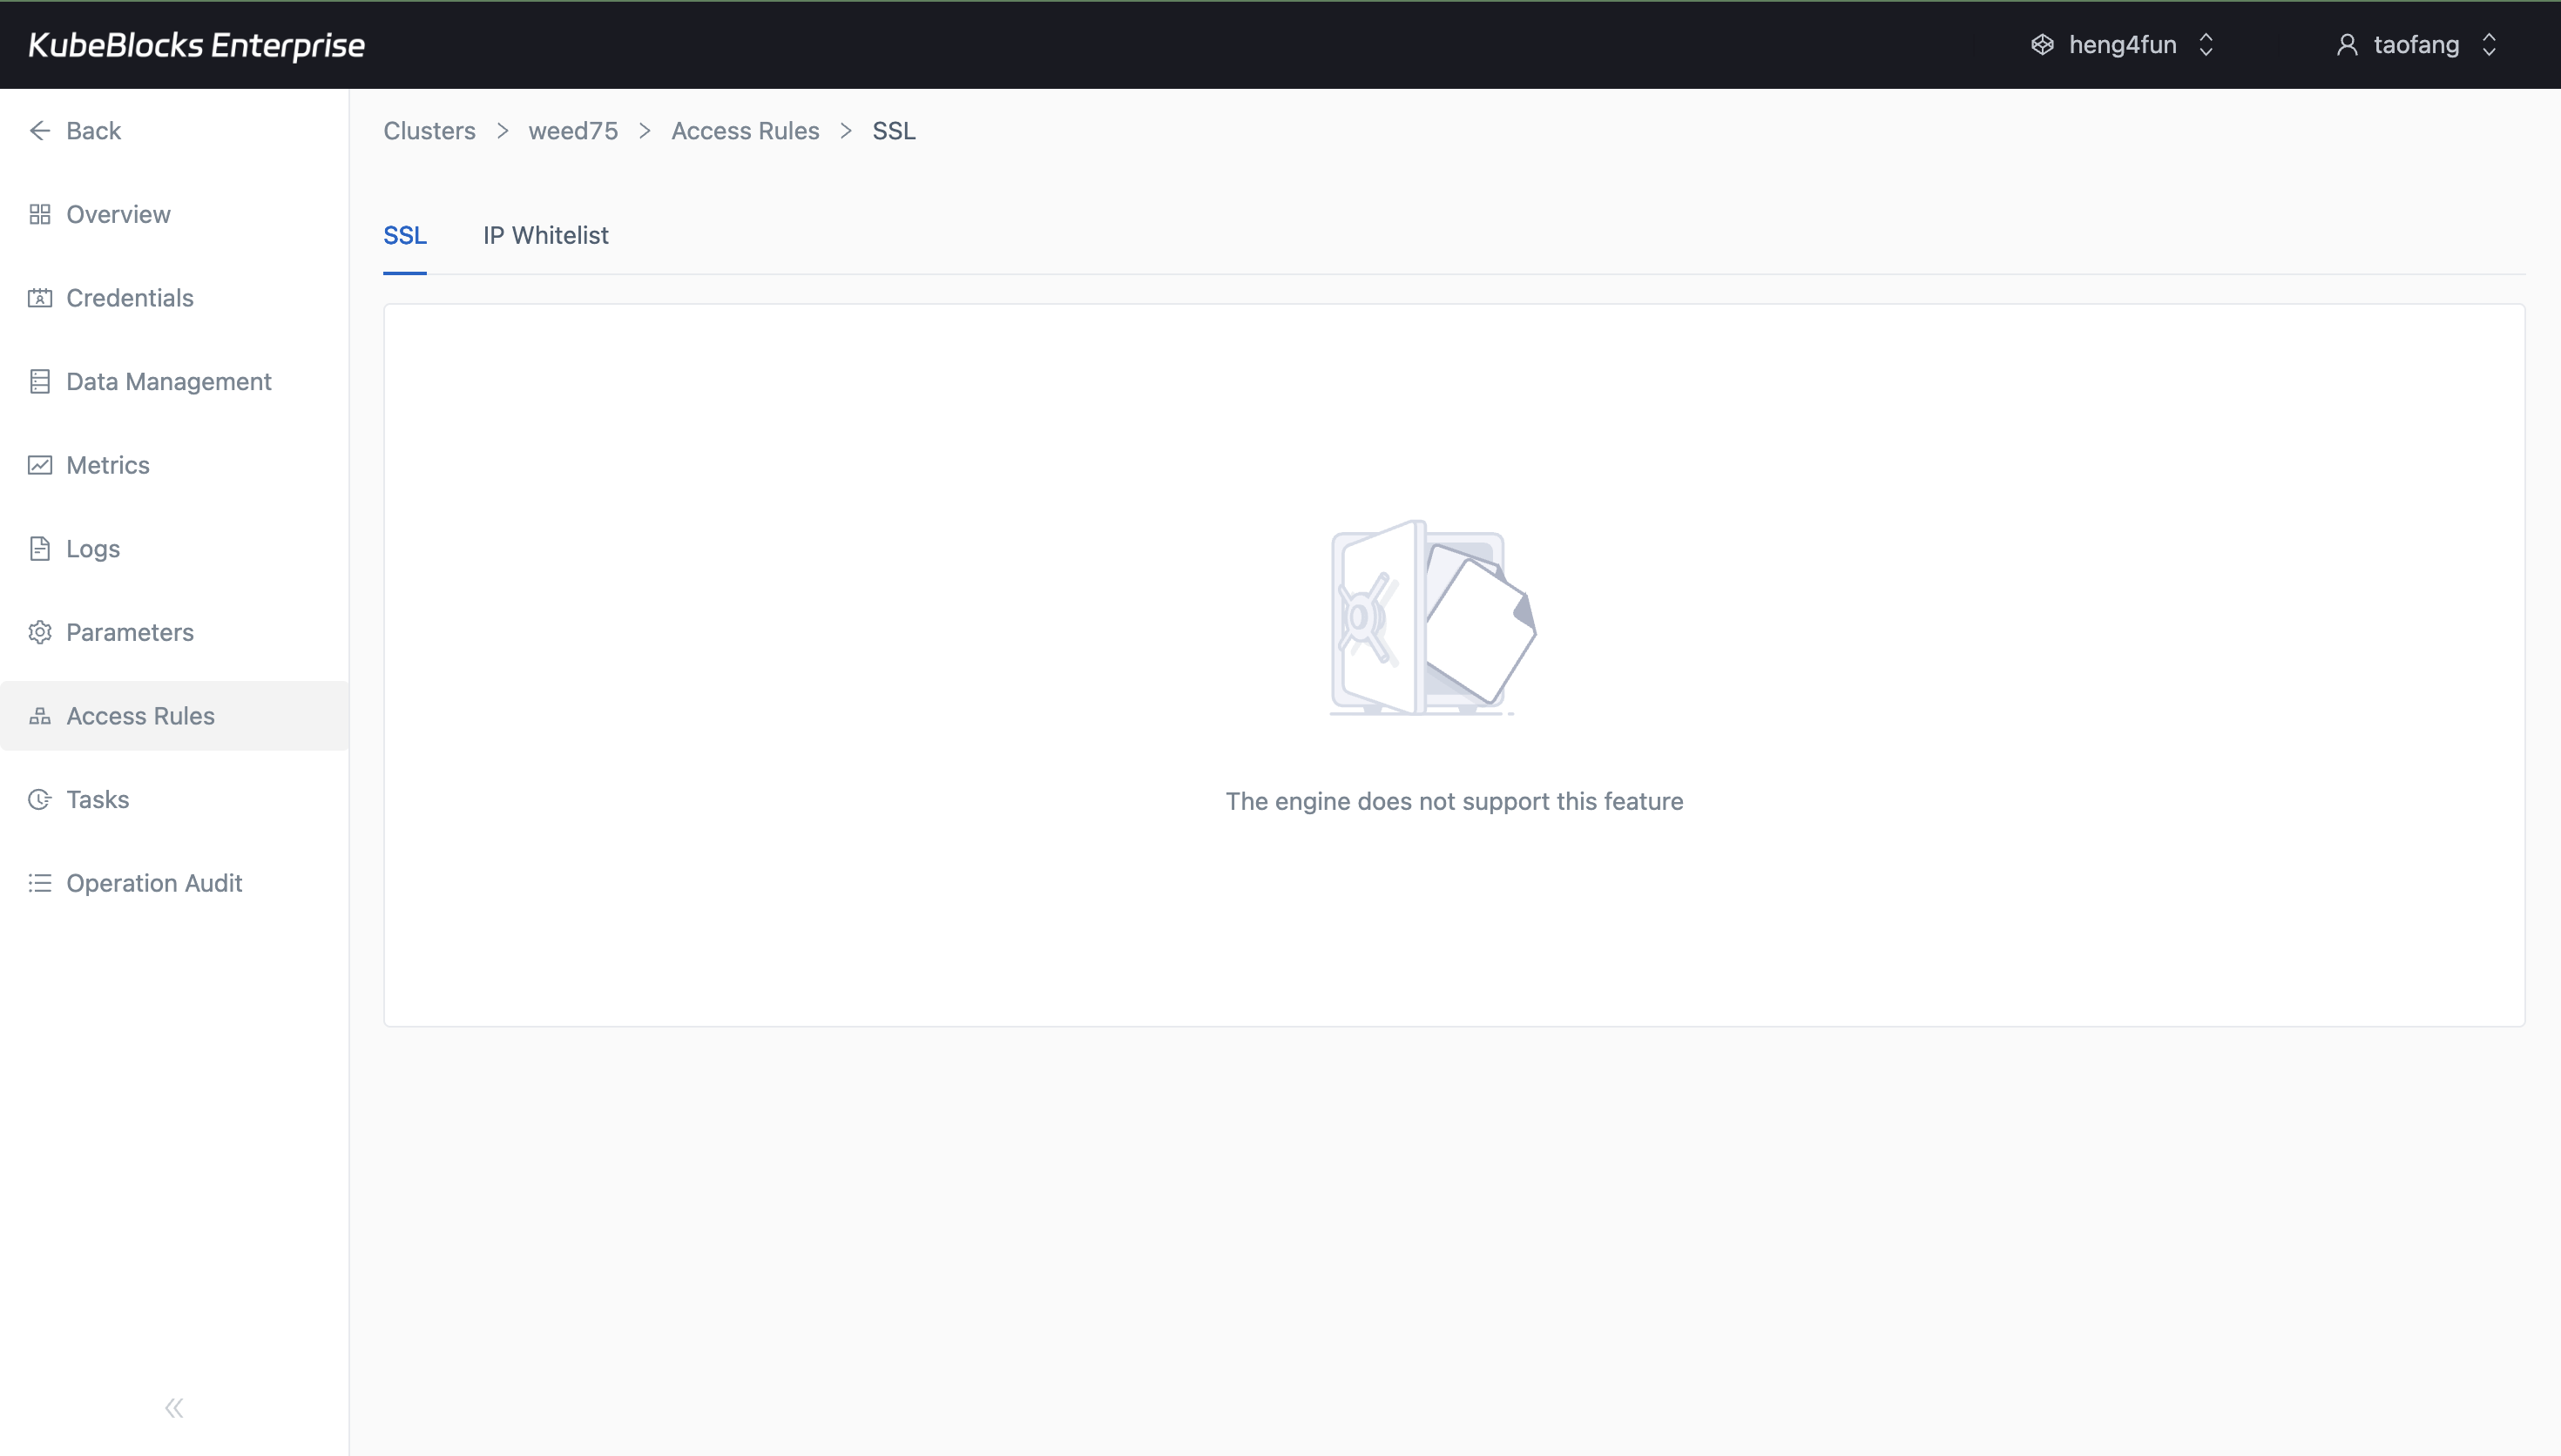
The IP Whitelist page shows the current default group and where users add or tighten source access rules.
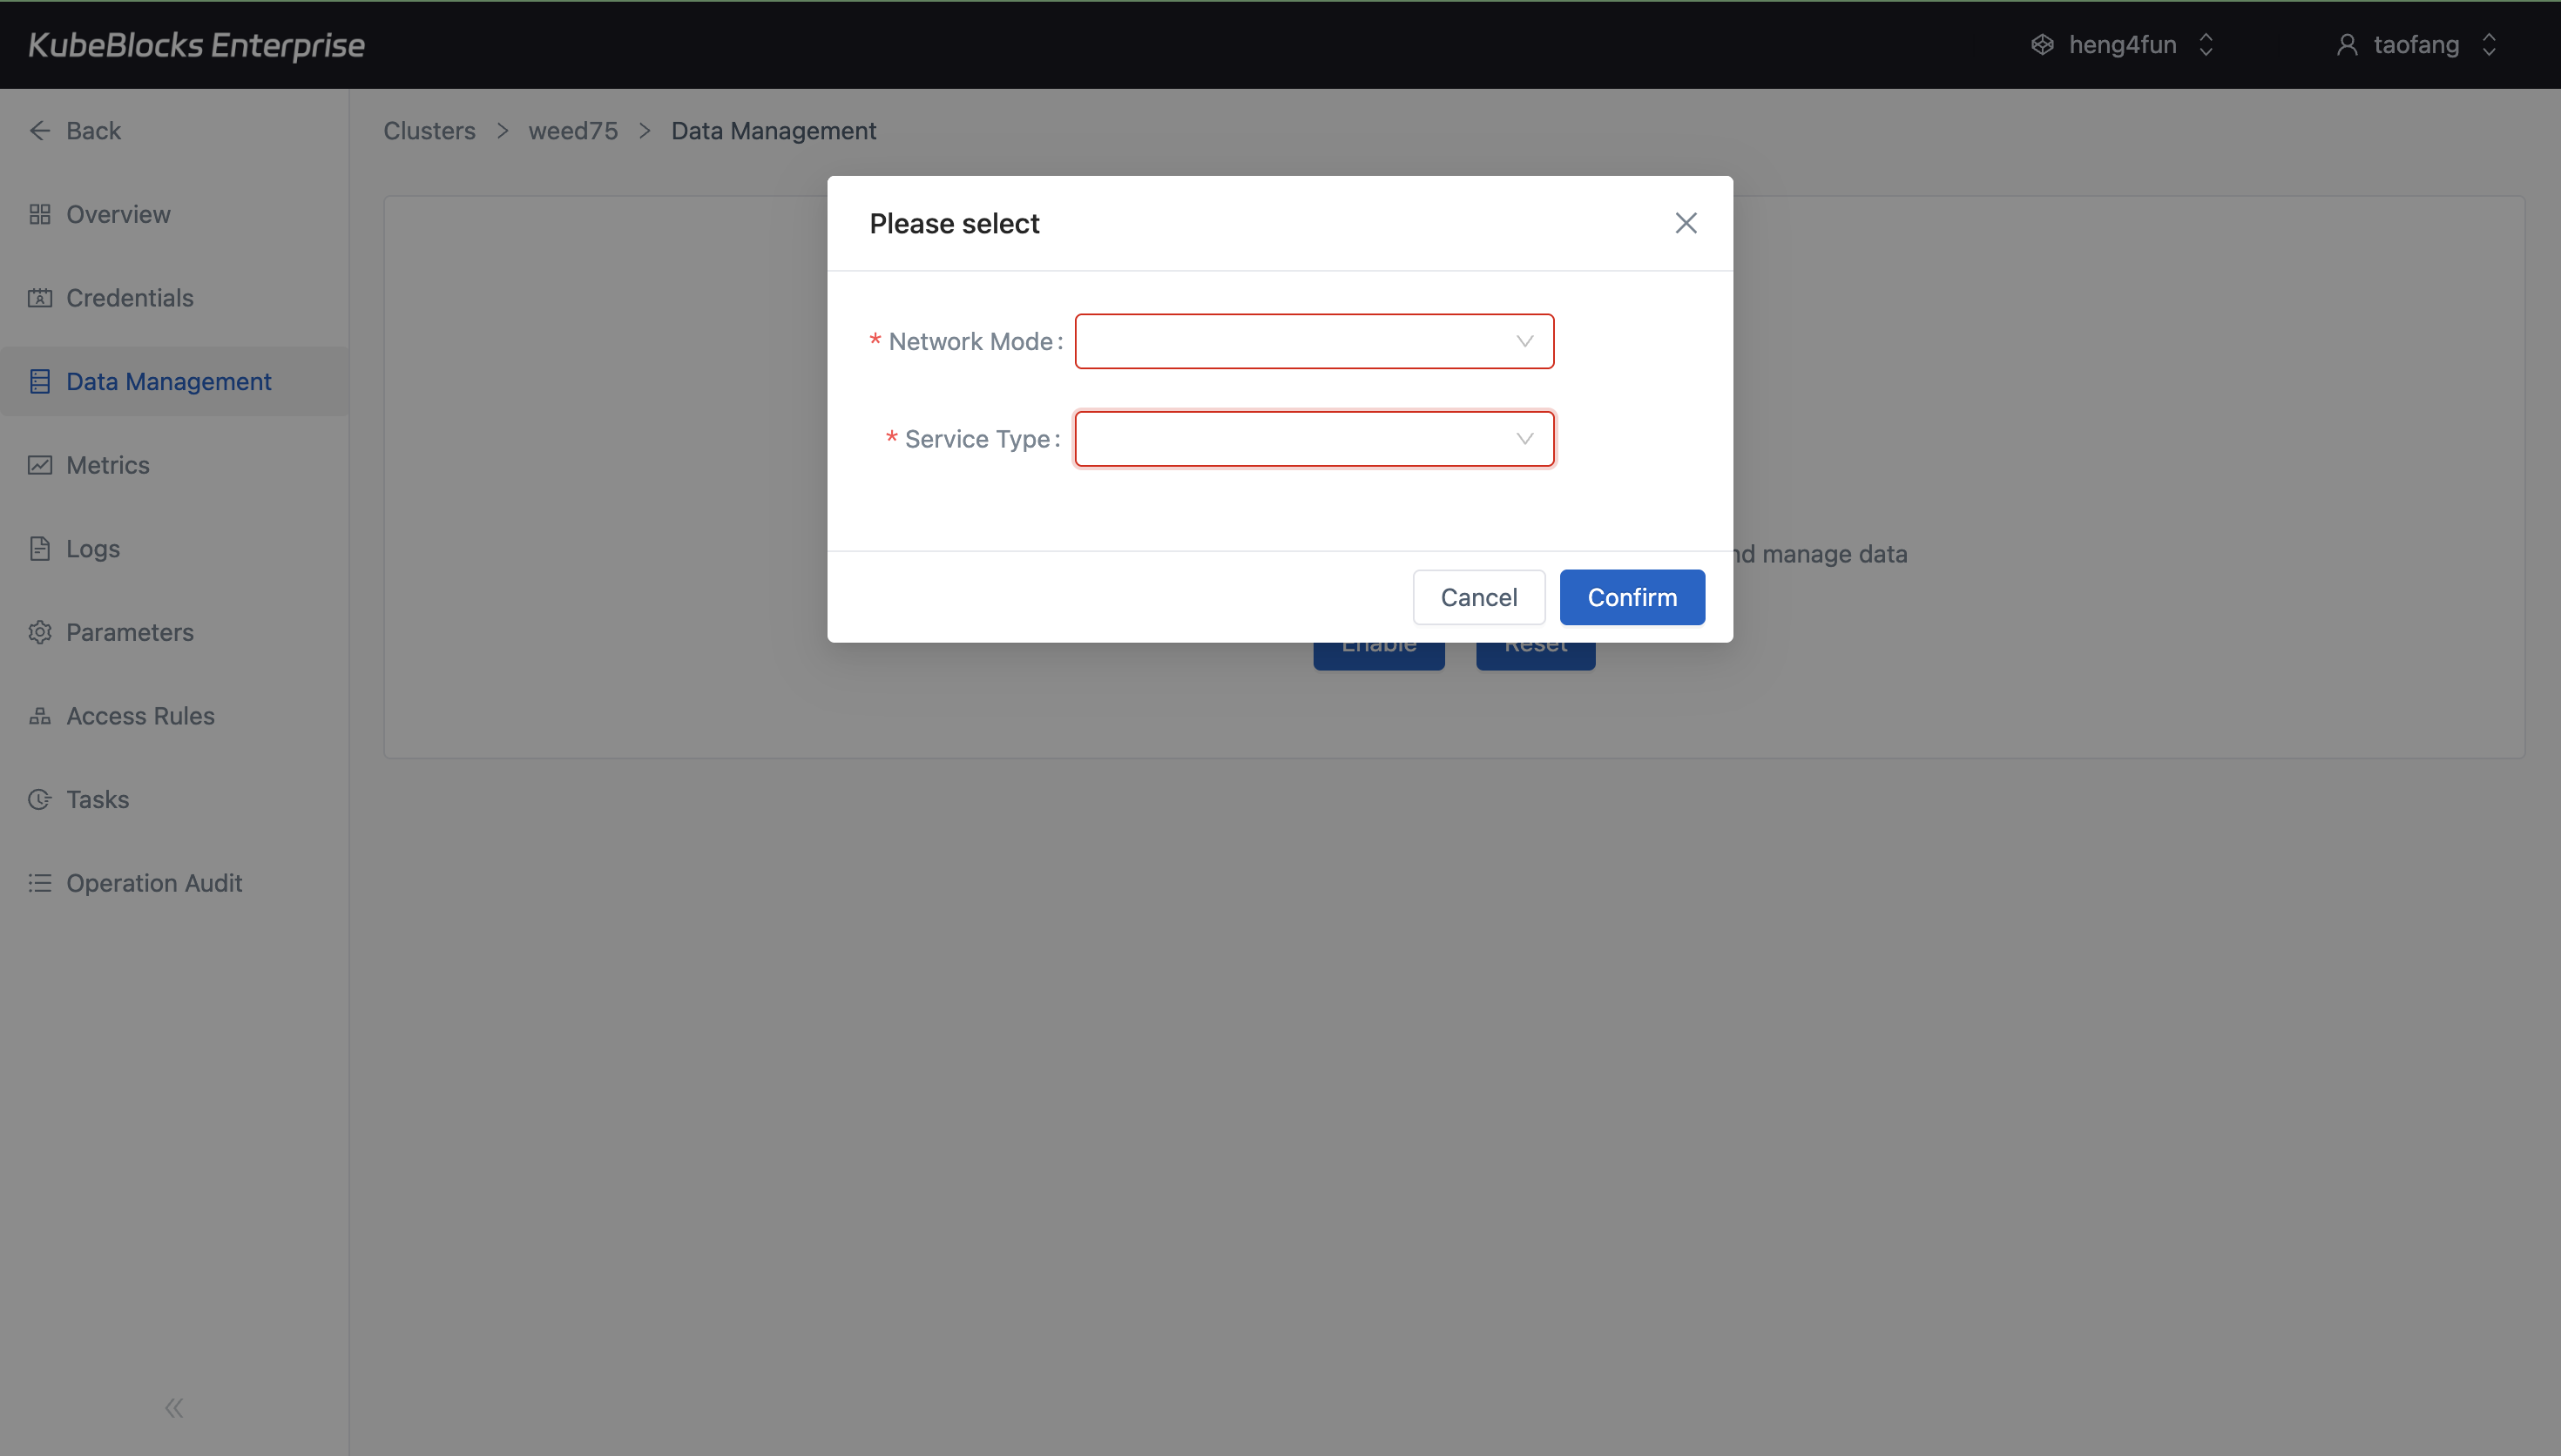
Control RabbitMQ access with IP whitelist groups
Access Rules keeps SSL and IP Whitelist controls together. In the tested cluster, the IP Whitelist page exposed the default whitelist group, the `Allow All` action, and the entry point for adding stricter source ranges.
- Open the IP Whitelist tab directly from the RabbitMQ cluster workspace.
- Review the default whitelist group and the current `0.0.0.0/0` entry before tightening access.
- Add stricter whitelist groups from the same page when users need narrower source controls.
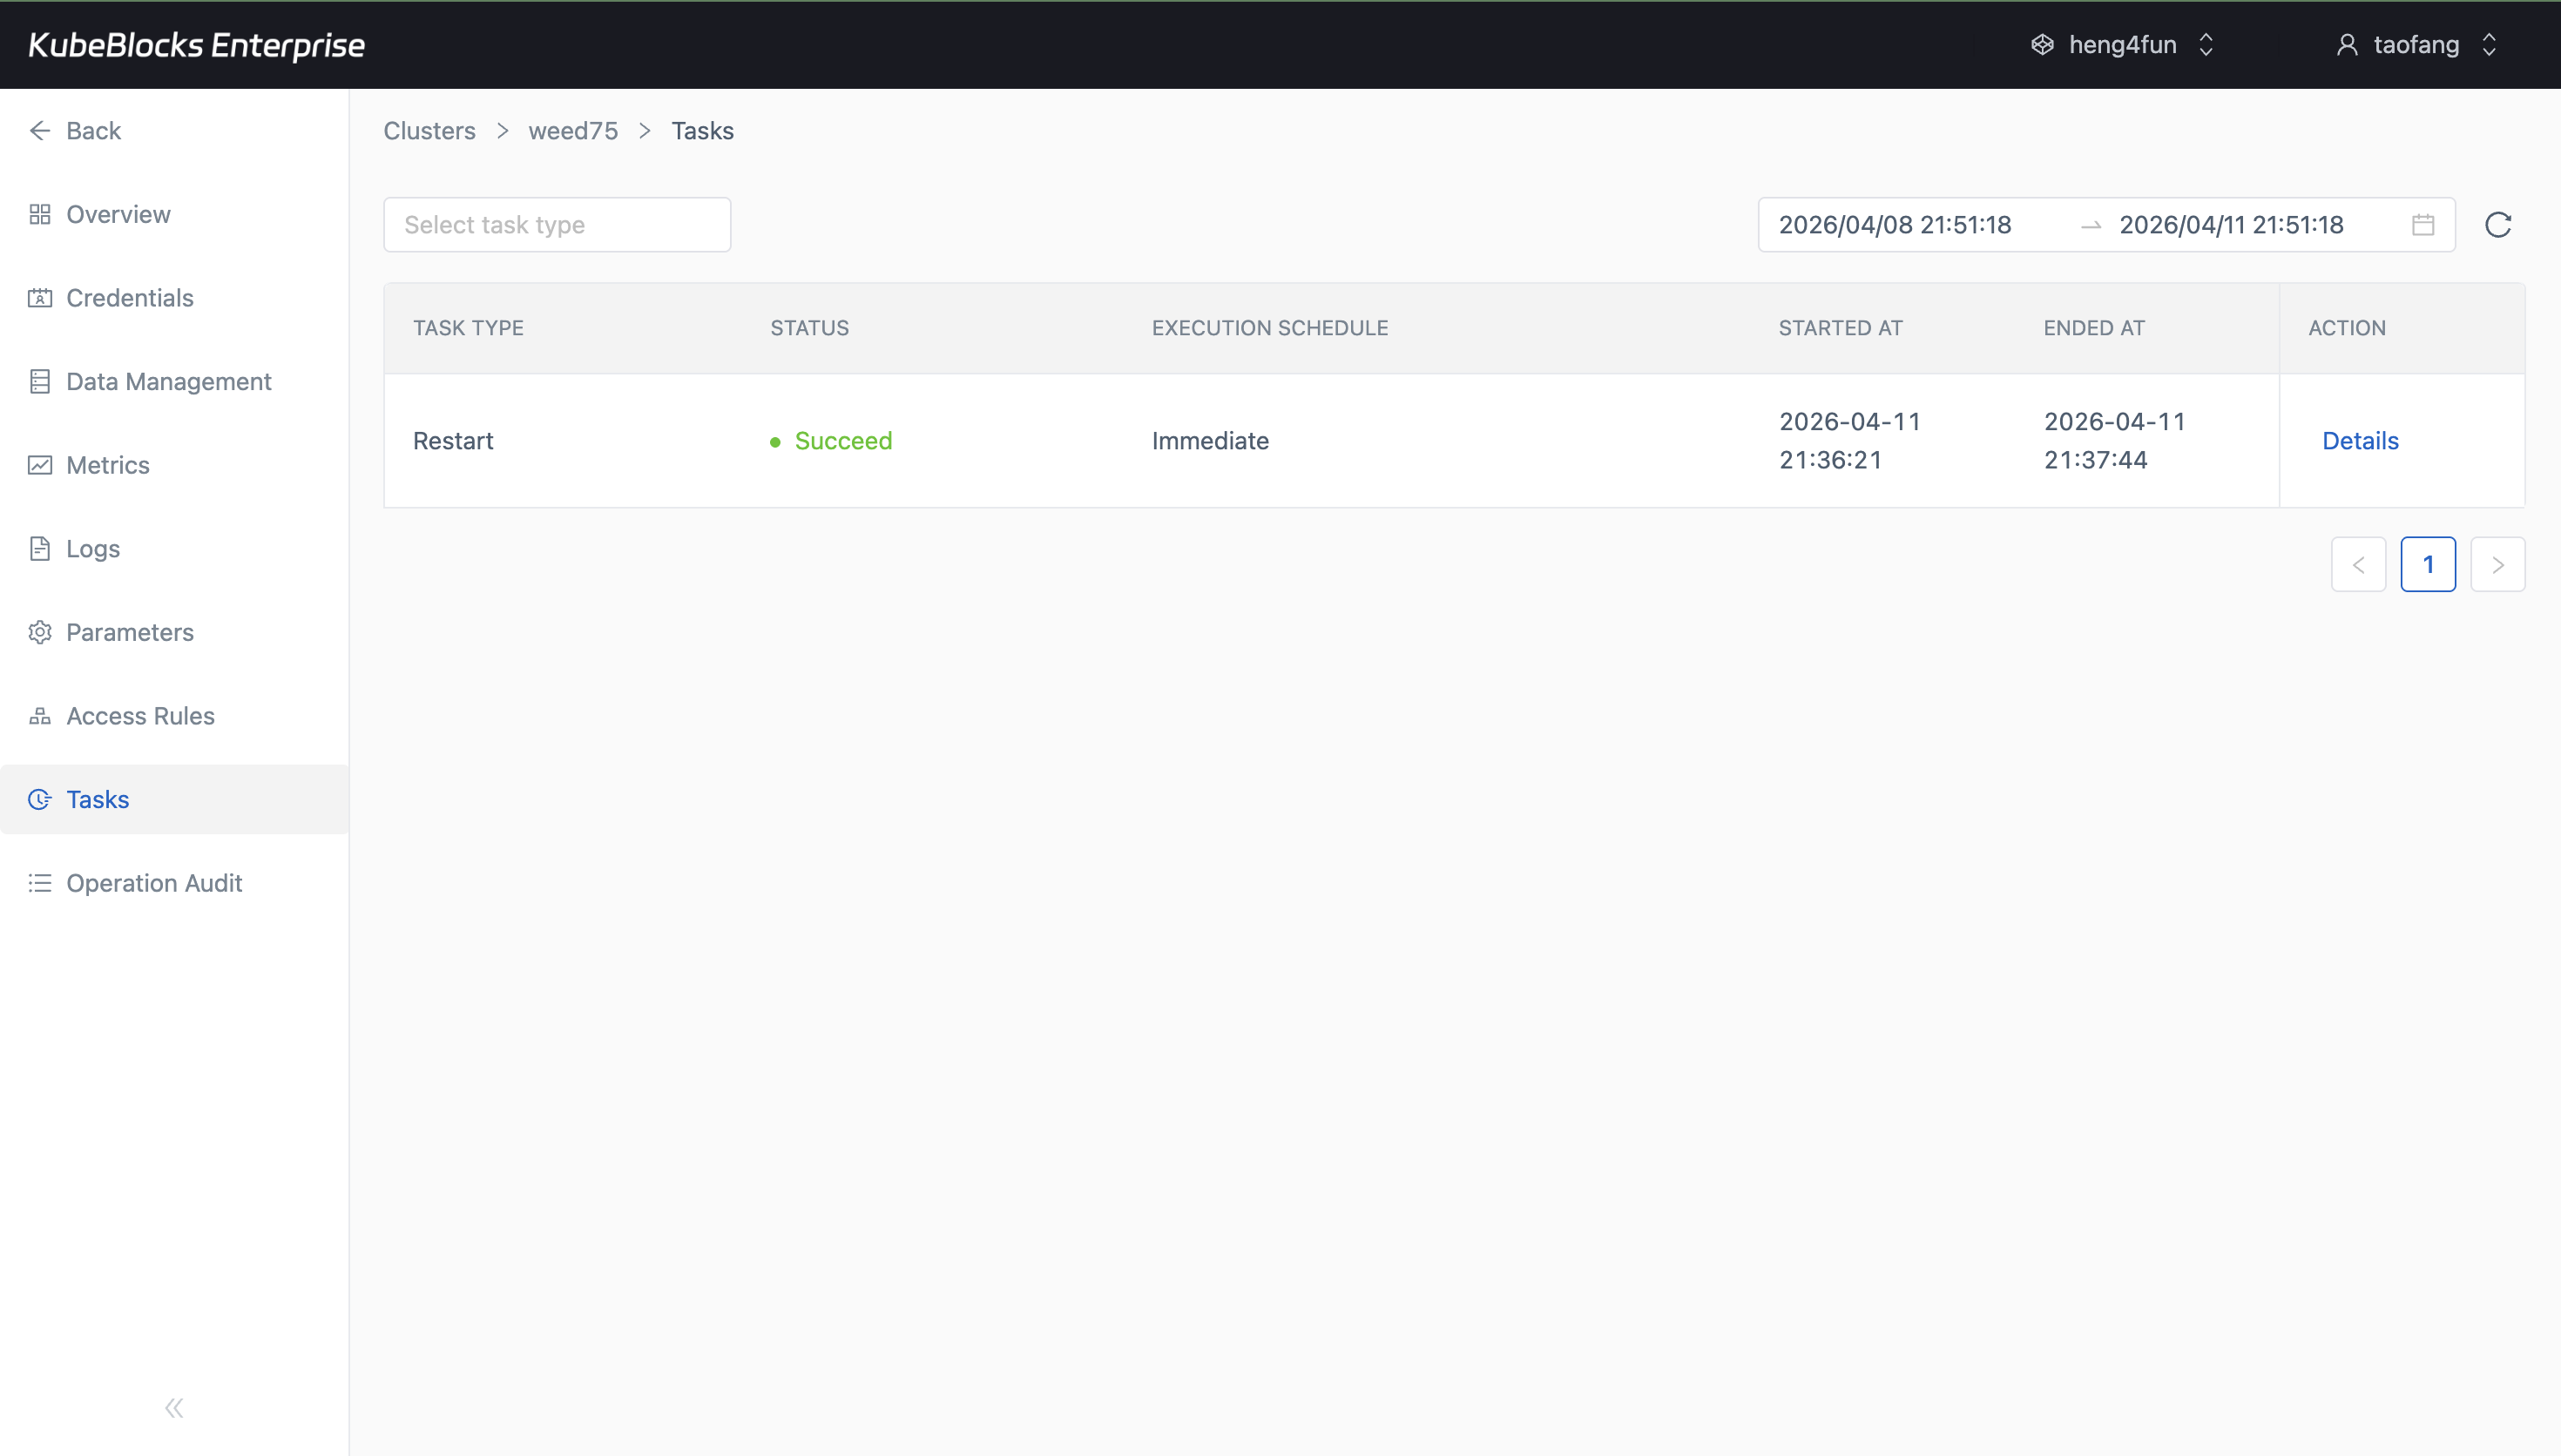
Task history provides a compact audit trail for RabbitMQ operations that completed in the console.
Keep RabbitMQ operational history visible through task records
Use task history to confirm what ran, what succeeded, and which day-2 operations produced real state changes during cluster management.
- Review completed RabbitMQ restart activity from a dedicated task timeline.
- See when operational actions succeeded before handing the cluster back to users.
- Use the task page as lightweight audit evidence for operational review.
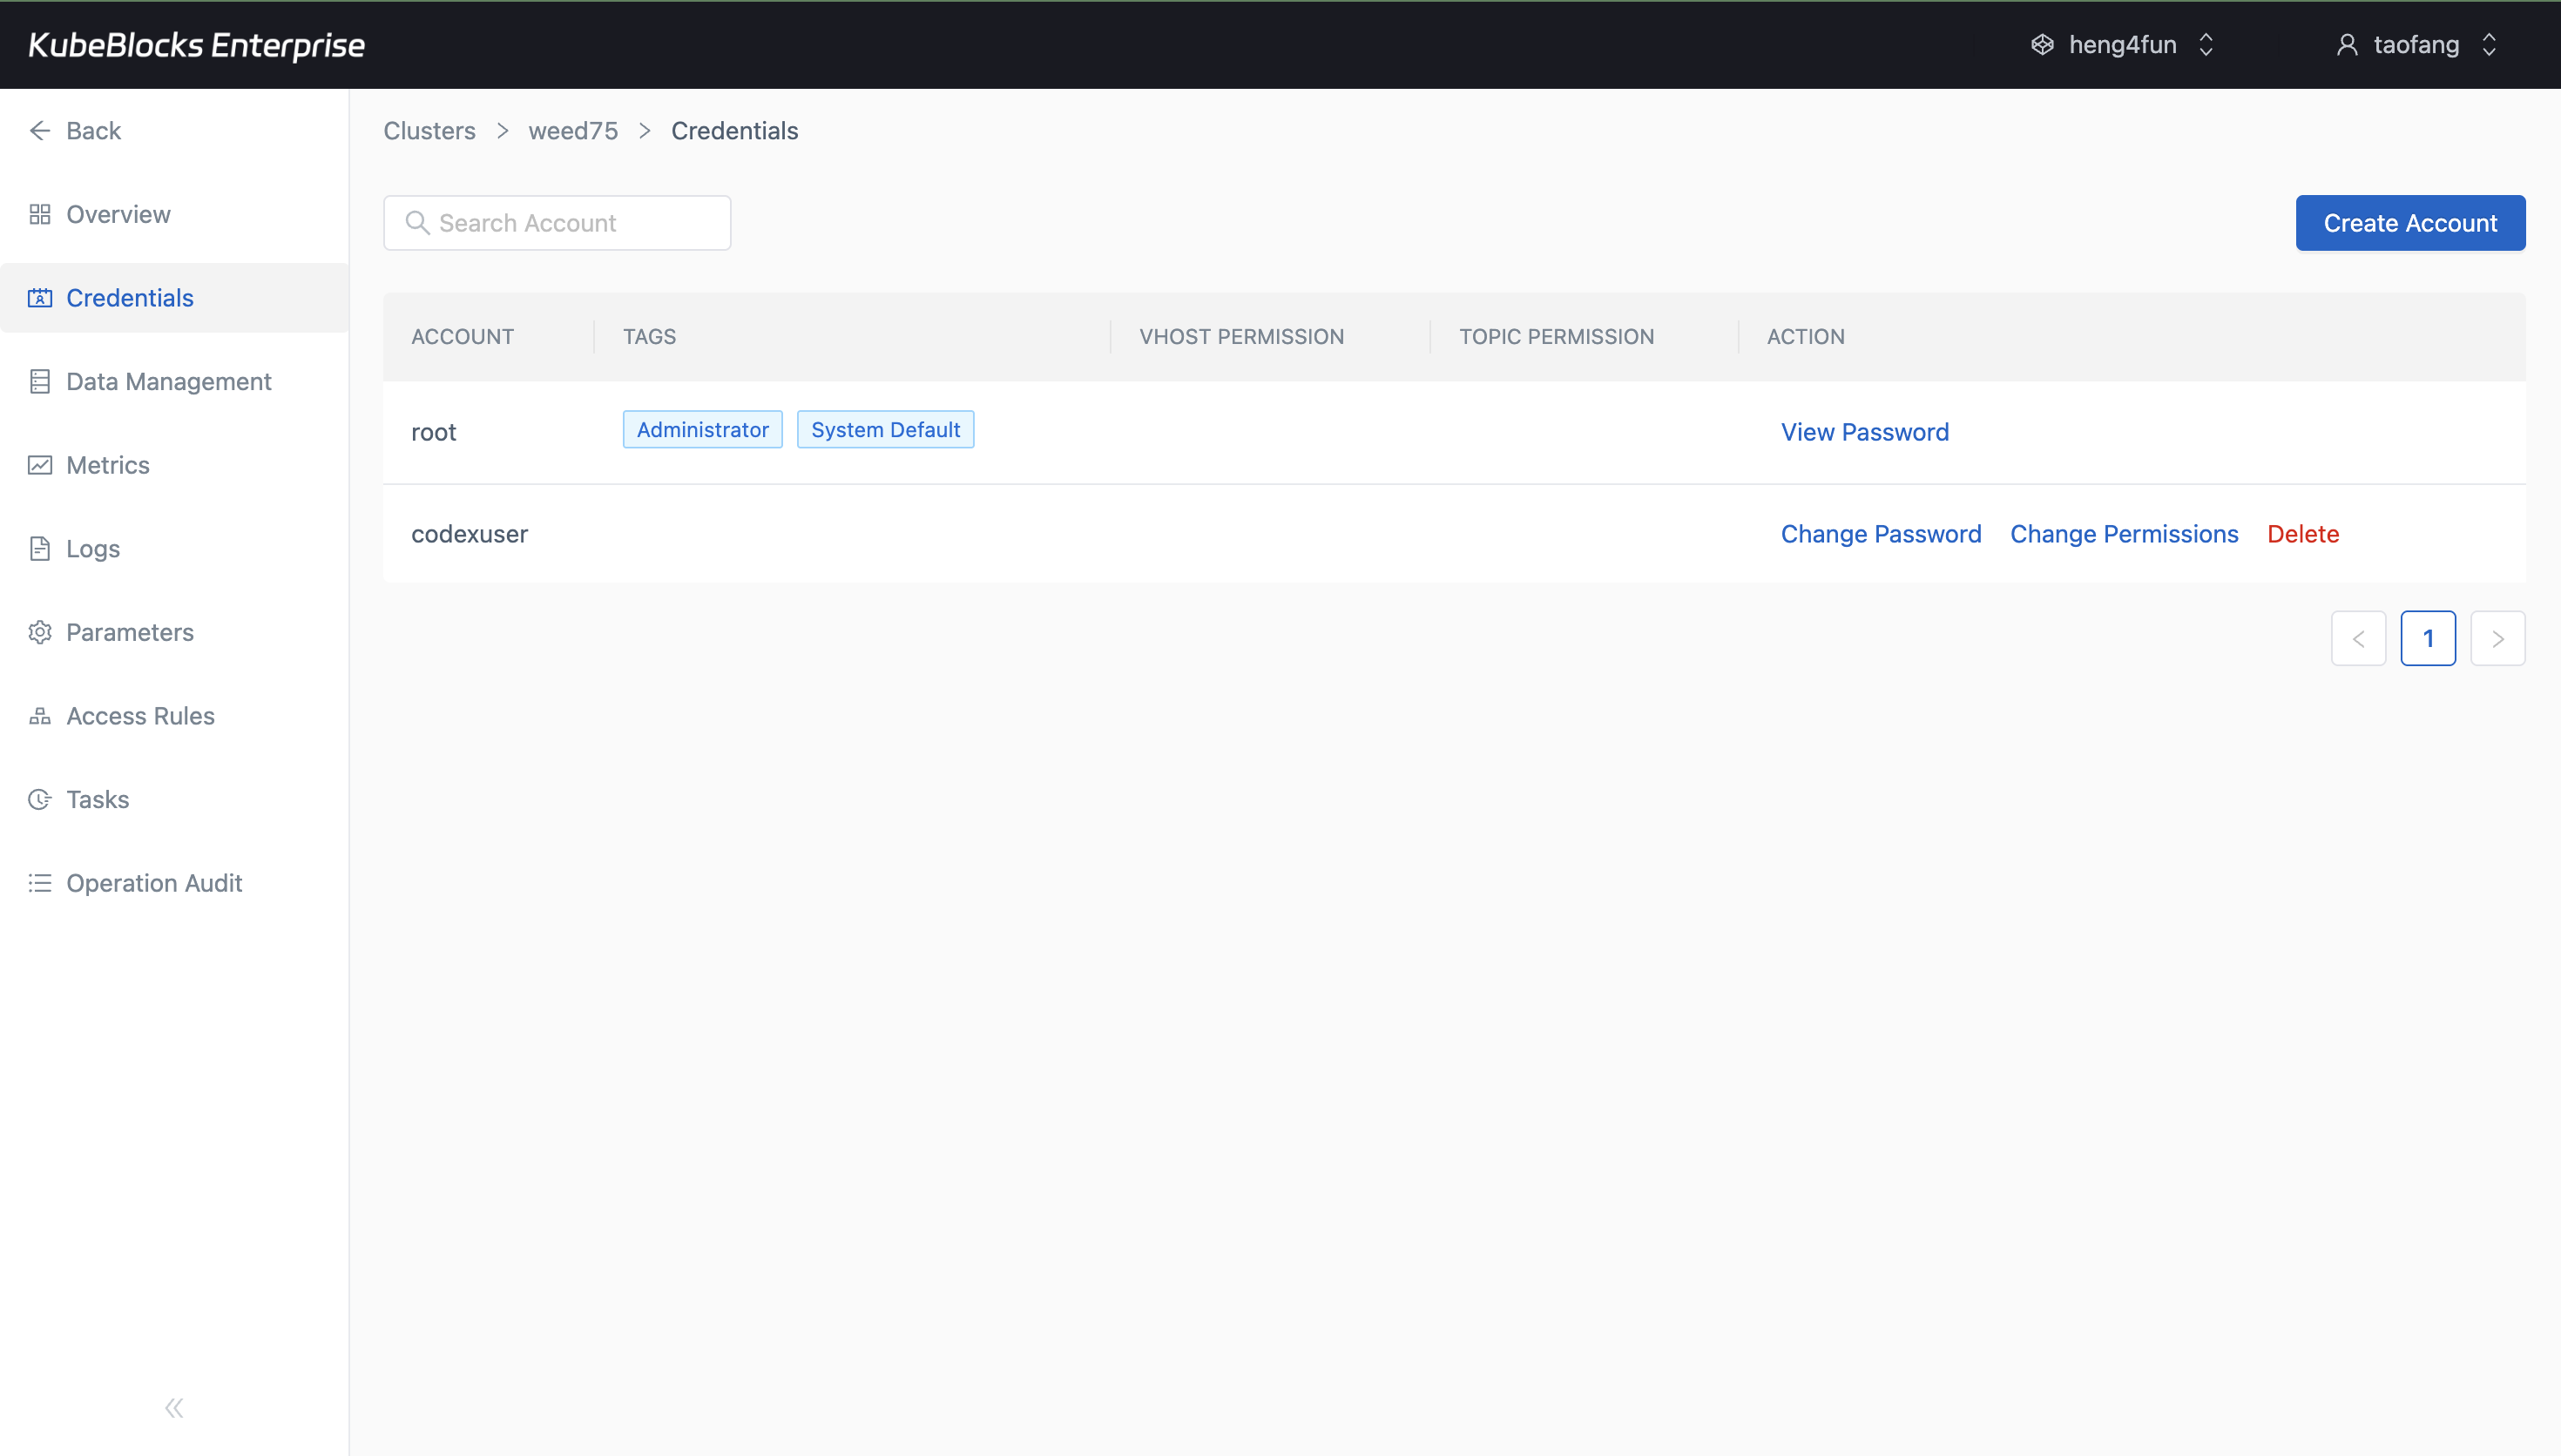
Credentials shows the built-in RabbitMQ management account and where users reveal the login password.
The RabbitMQ Management console confirms that the topic exchange, queue, and binding exist on the live cluster.
Use cluster credentials and the public management endpoint for topic workflows
RabbitMQ keeps account review in the Credentials route and hands users off to a public LoadBalancer endpoint for the RabbitMQ Management console. In the validated flow, the built-in `root` account was used to sign in, and a real topic exchange plus queue binding were created and verified.
- Reveal the built-in `root` account from Credentials when teams need the management console login.
- Open the public management endpoint created through Data Management instead of stopping at the handoff page.
- Verify `codex.topic.x`, `codex.topic.q`, and the `codex.#` binding from the live RabbitMQ Management UI.
Want full Day-2 operations on Kubernetes? Supported by KubeBlocks RabbitMQ Kubernetes Operator →
Ready to build your own DBaaS on Kubernetes?
Talk to our team and see how KubeBlocks Enterprise can help you consolidate databases, strengthen security, and reduce operational costs.