
KubeBlocks for
Qdrant
Qdrant is a high-performance vector similarity search engine built in Rust. It provides advanced filtering, payload storage, and distributed deployment — making it the ideal choice for AI-powered search, recommendation systems, and RAG applications.
Supported versions
Available on
 AWS
AWS Azure
Azure GCP
GCP OCI
OCI Alibaba Cloud
 Rancher
 OpenShift
Databases
 MySQL
MySQL PostgreSQLOracle
 SQL Server
 Redis
Redis MongoDB
 ClickHouse
Vector & AI
 Qdrant
 Milvus
 Elasticsearch
Message queues
 RocketMQ
 RabbitMQ
 Kafka
KafkaOthers
 VictoriaMetrics
 InfluxDB
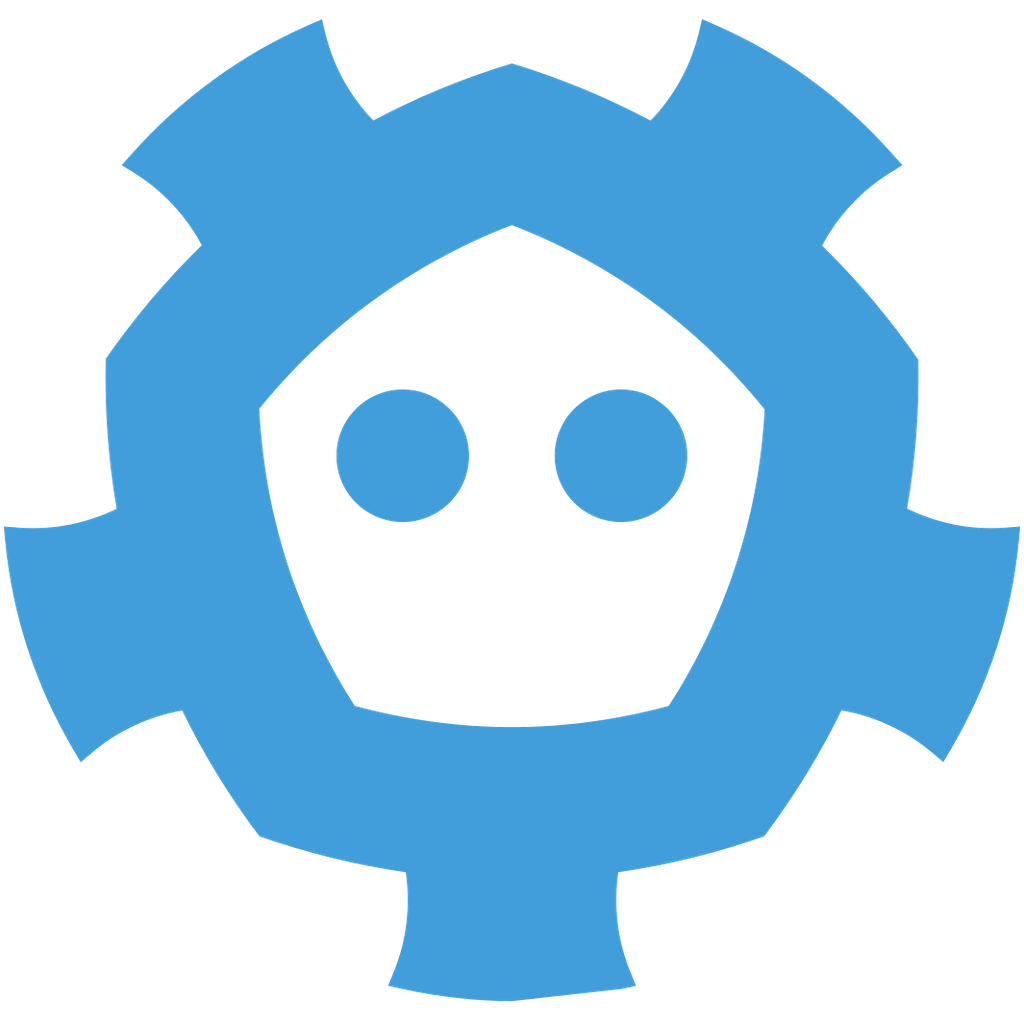 etcd
etcd ZooKeeper
Extend database engines like plug-ins
KubeBlocks provides unified database operations through its addon-based architecture. With KubeBlocks Enterprise, access over 15 seamless integrations to scale your database services.
One control plane, consistent operations across all engines — powered by the addon mechanism.
Run Qdrant with guided lifecycle, scaling, observability, and recovery workflows
Operate Qdrant with a rich create wizard, replica, compute, and storage scaling, backups, metrics, IP whitelist controls, and task history backed by real KubeBlocks Enterprise evidence.
The create wizard keeps Qdrant replication, compute, storage, backup, and project choices visible before provisioning.
Create Qdrant clusters with replication, sizing, and backup choices visible
Launch Qdrant from a guided create wizard that keeps cluster mode, engine version, environment, CPU and memory class, storage, replica count, backup policy, maintenance window, and project placement visible before provisioning begins.
- Choose Standalone or Replication mode, Qdrant 1, and the target minor version before users create the cluster.
- Review CPU and memory, storage class, storage size, replica count, automatic backup, and maintenance-window settings in one workflow.
- Confirm the generated cluster summary before the deployment moves into the day-2 operations workspace.
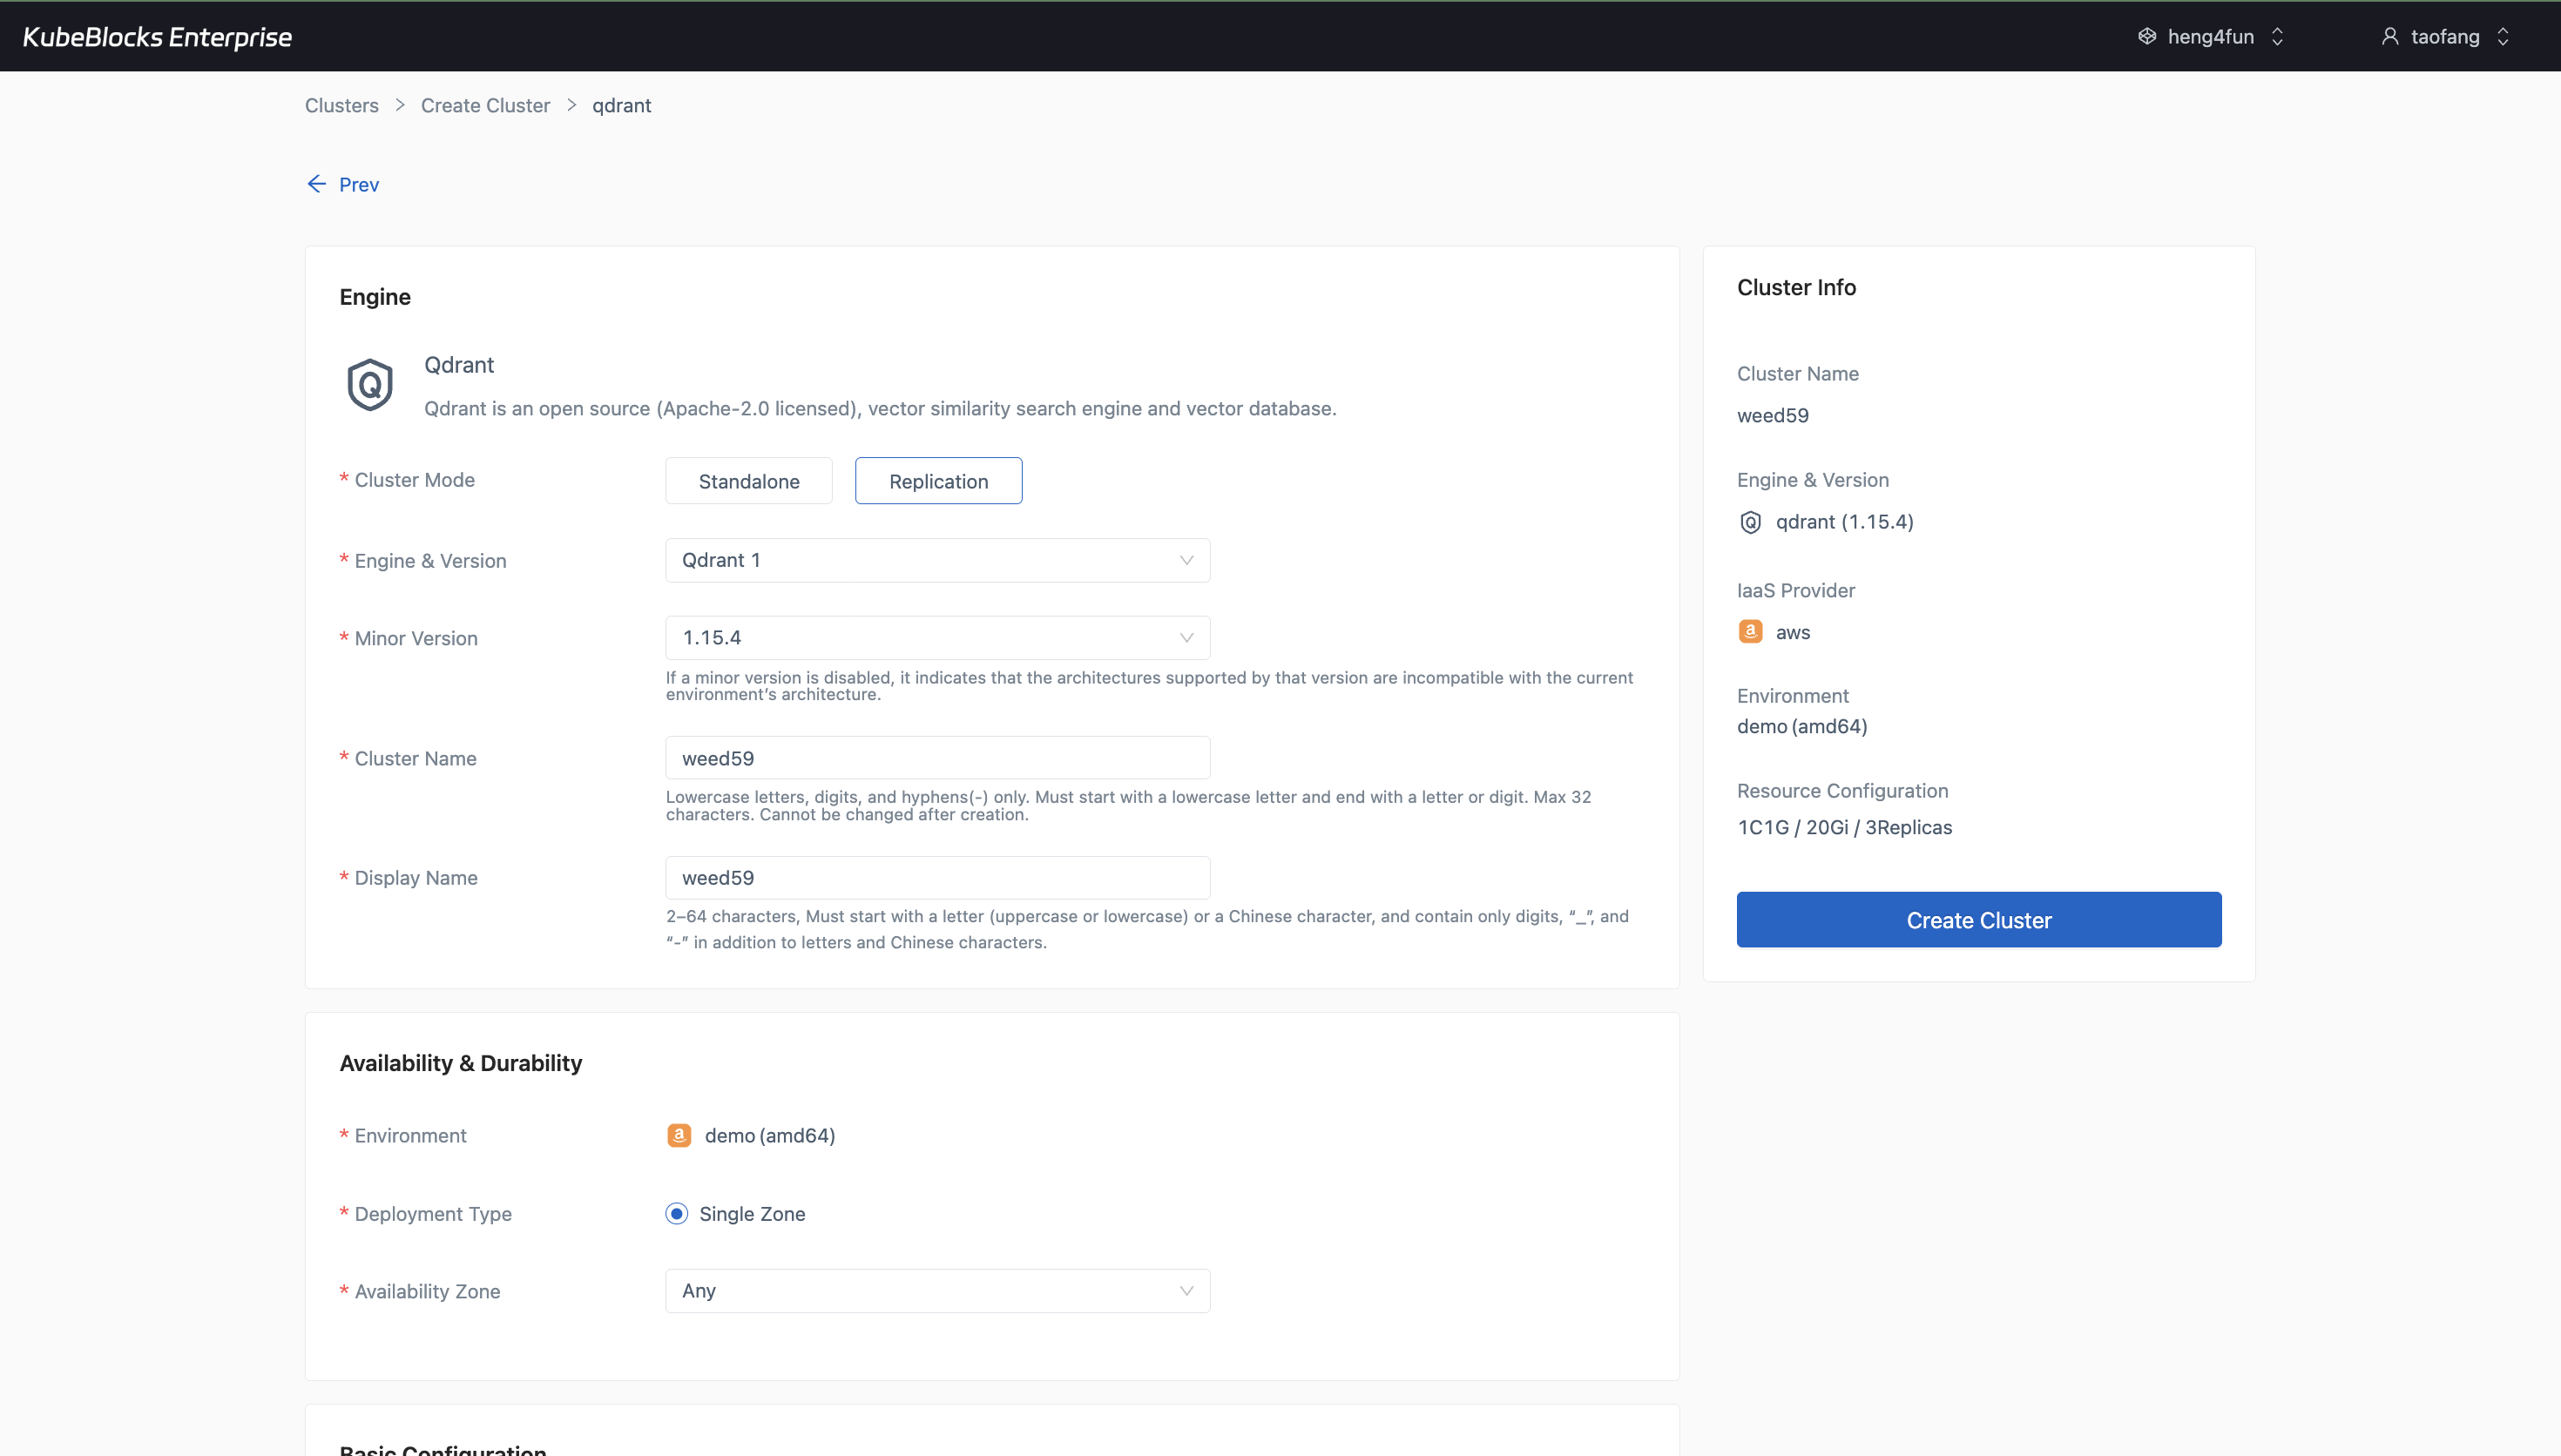
Horizontal Scaling keeps Qdrant replica-count changes visible before users save a topology update.
Adjust Qdrant replicas before changing topology
Horizontal Scaling gives users a focused place to review the current replica count and execution timing before adding more Qdrant replicas.
- Open Horizontal Scaling directly from the Qdrant overview instead of relying on a task-status screen.
- Review the current replica count before increasing replicated Qdrant capacity.
- Choose Immediate, Scheduled, or Maintenance Window execution timing before saving the topology change.
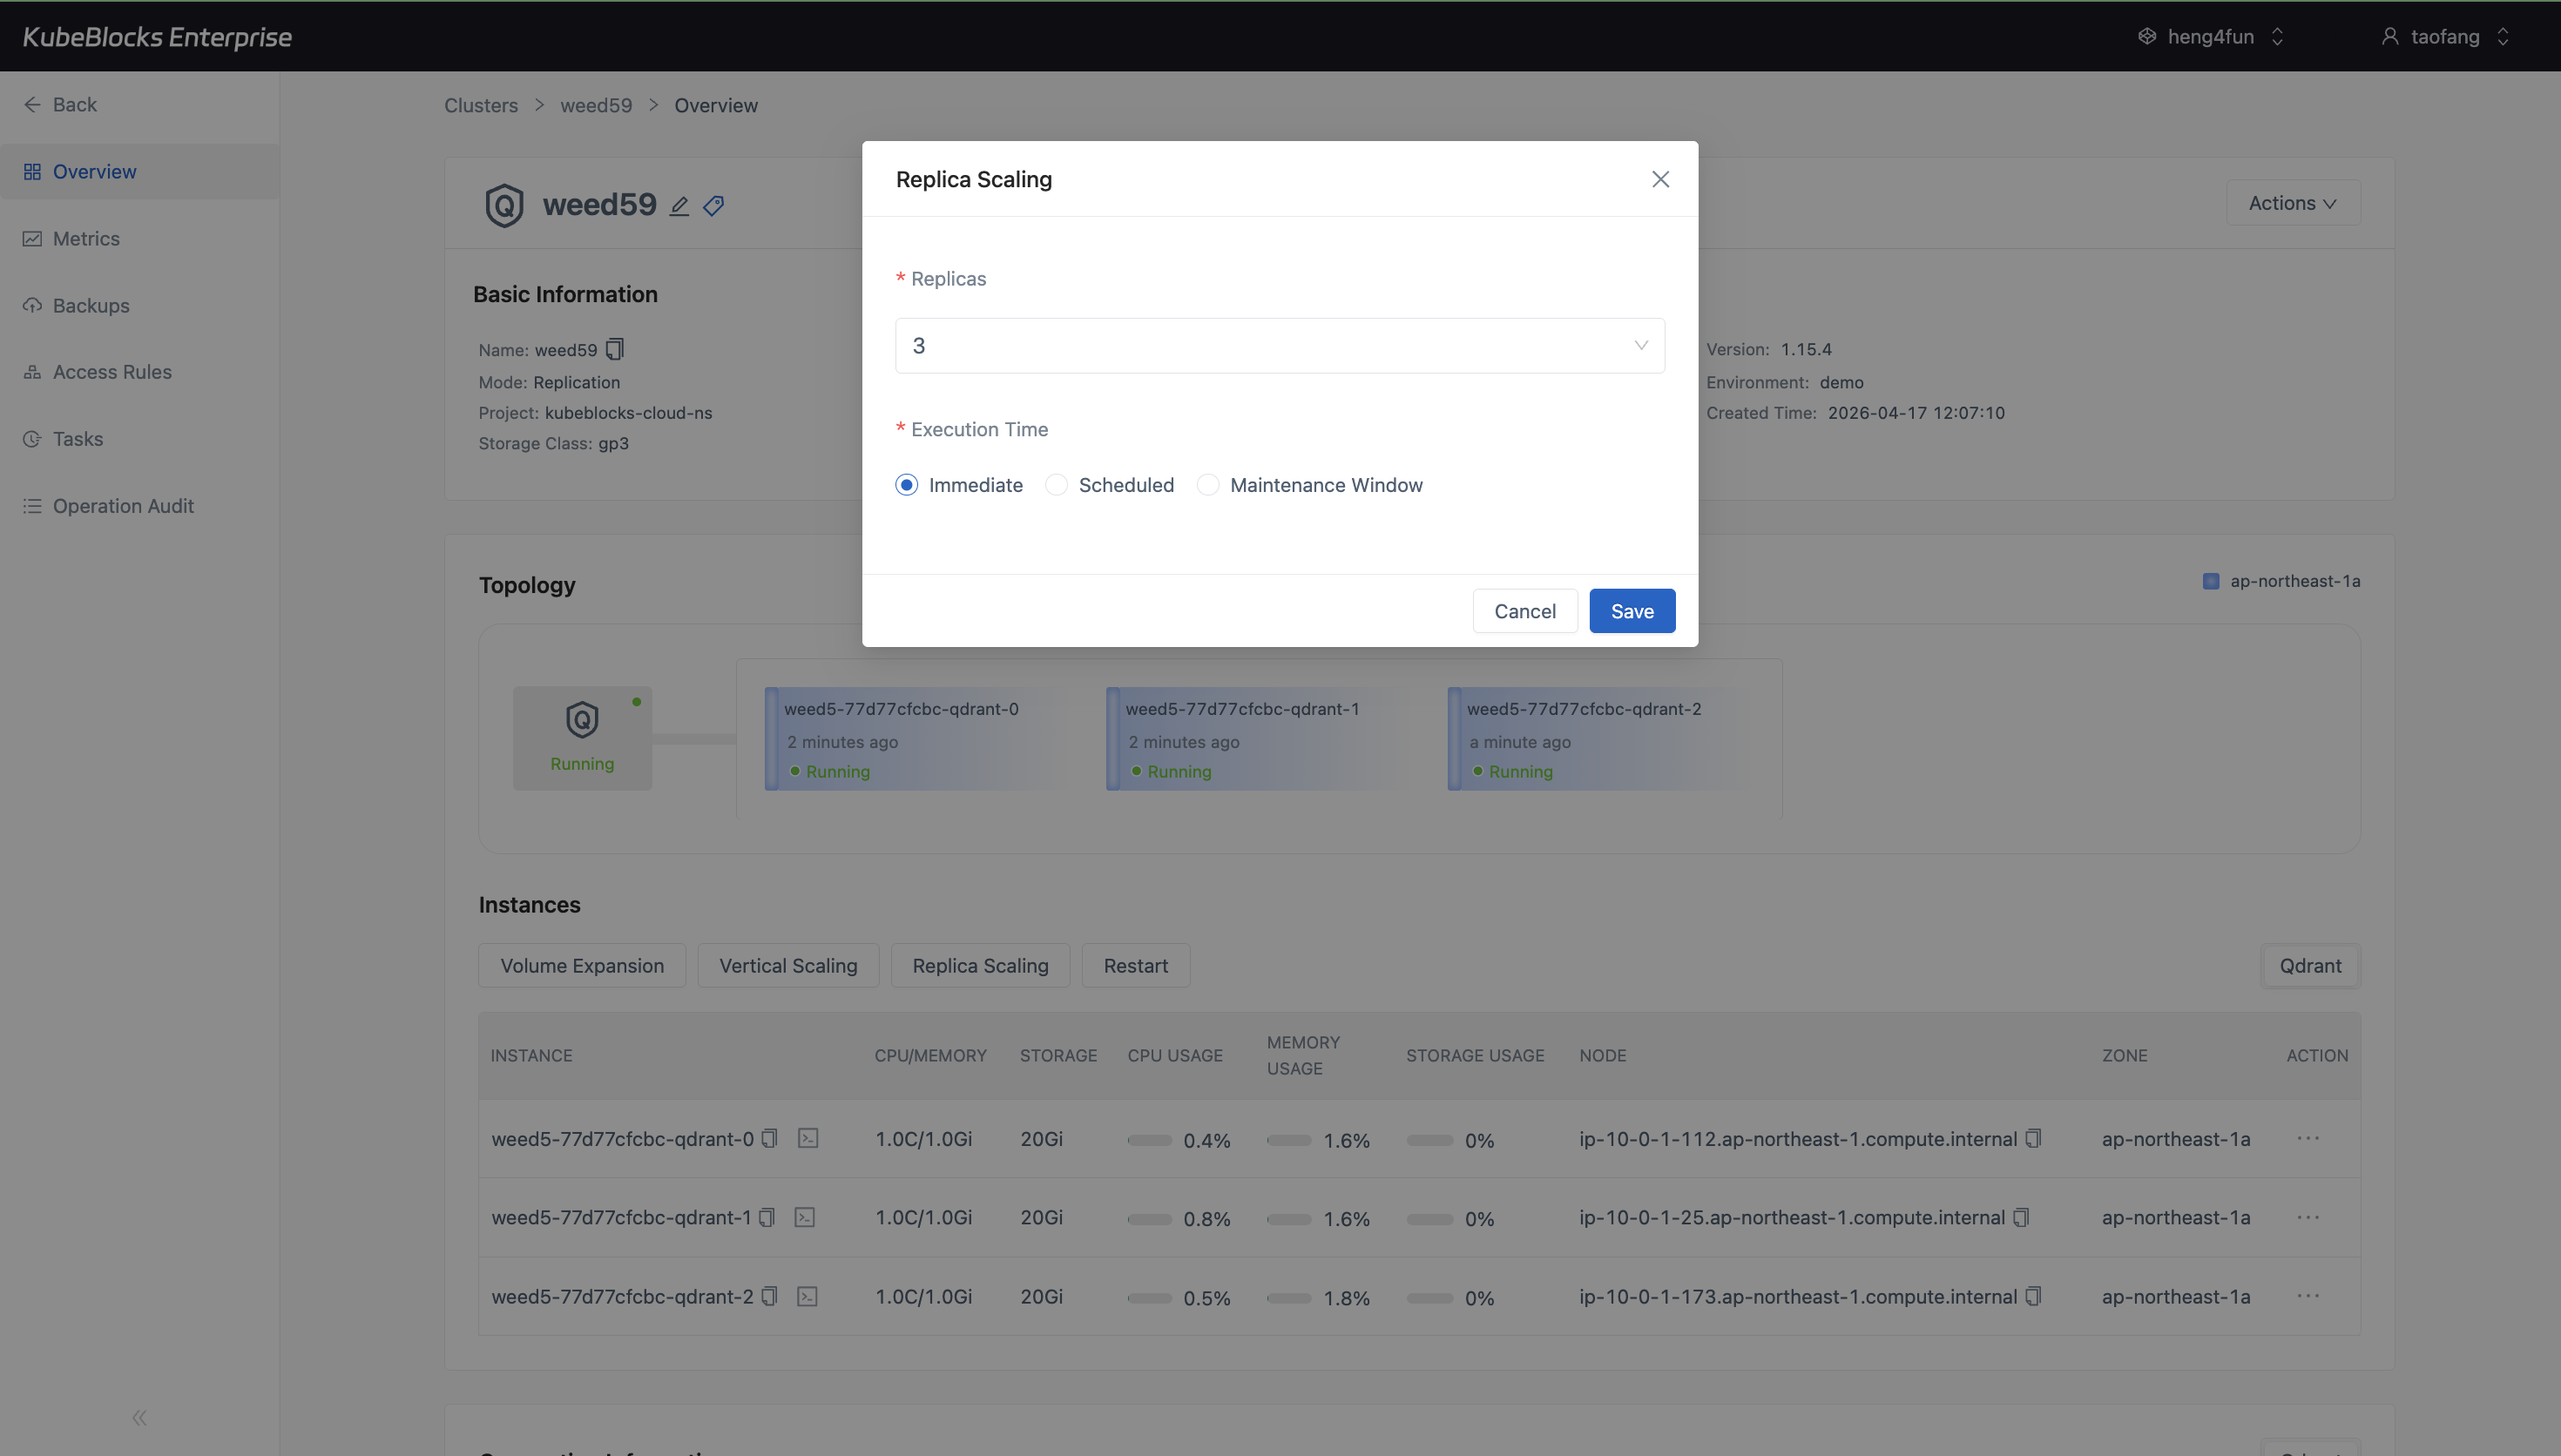
Vertical Scaling shows Qdrant CPU and memory choices plus execution timing before users save a compute change.
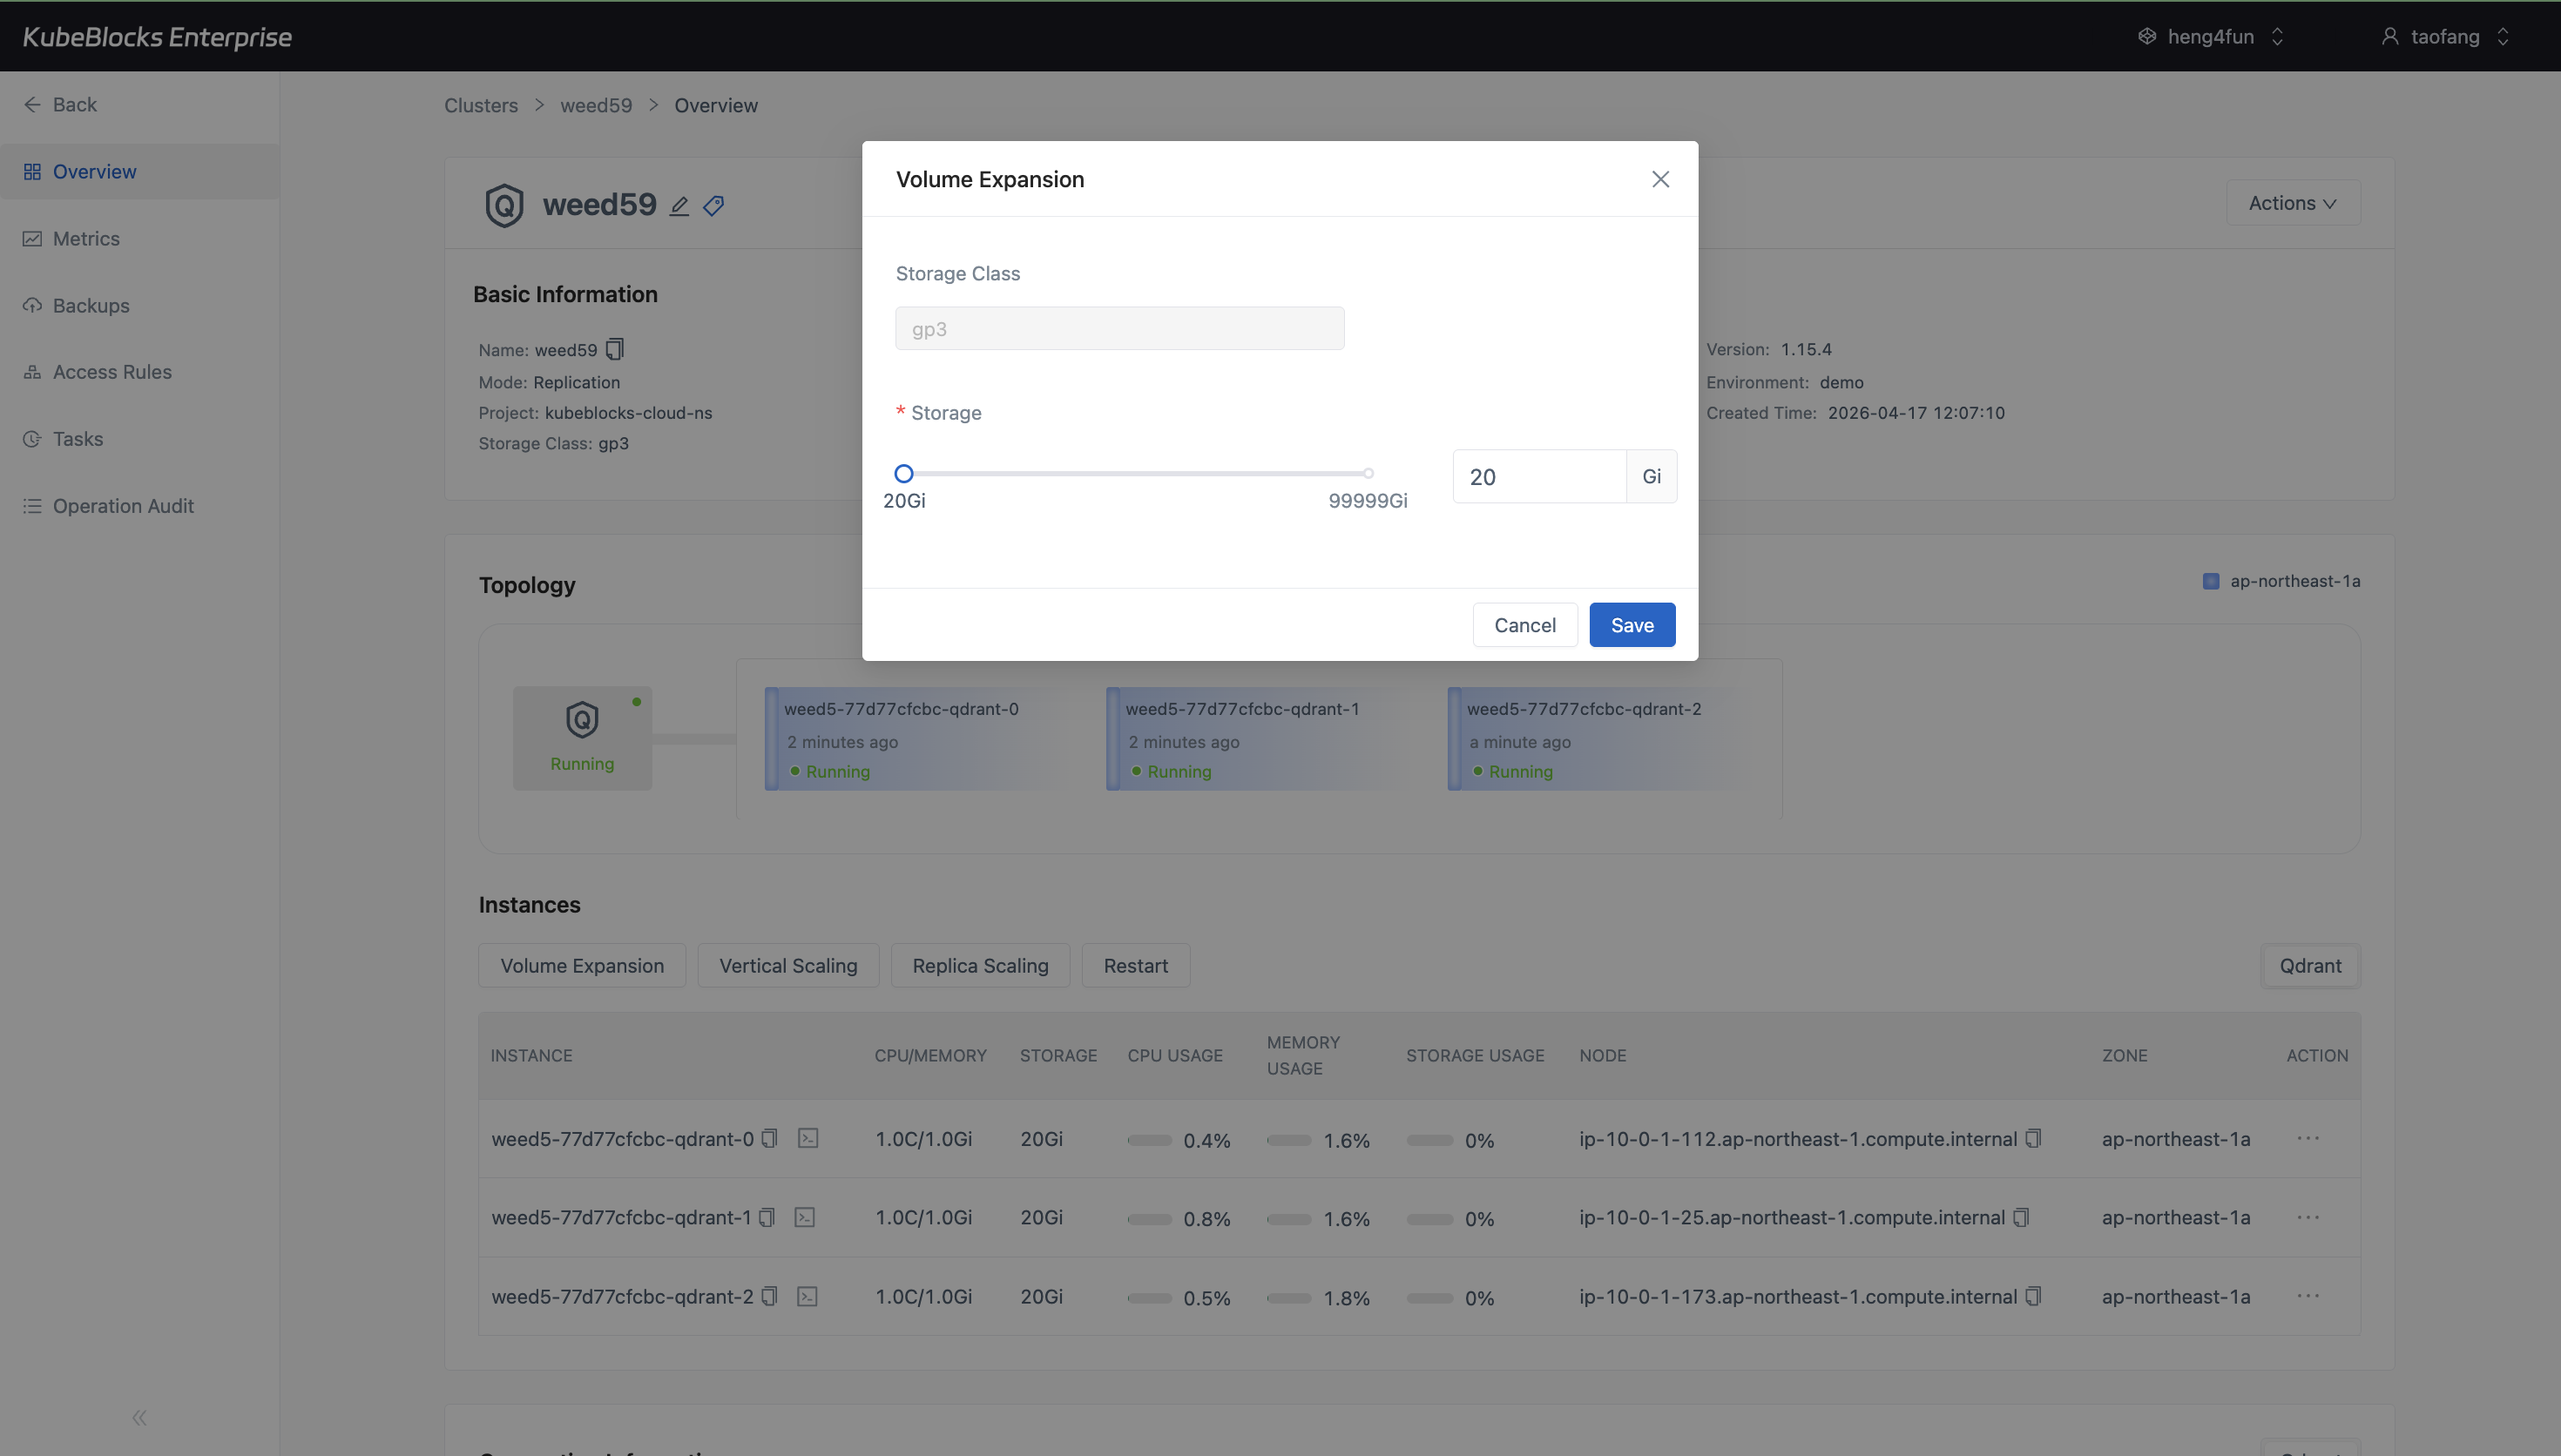
Volume Expansion keeps the storage class, current capacity, target capacity, and save action visible in one dialog.
Resize Qdrant compute and storage from dedicated dialogs
Vertical Scaling and Volume Expansion keep compute and disk growth separate from replica-count changes, so users can review CPU, memory, storage class, capacity, and execution timing before submitting a change.
- Use Vertical Scaling to compare Qdrant CPU and memory profiles before applying a compute update.
- Use Volume Expansion to review the current storage class and storage size before growing disks.
- Keep compute and storage planning focused on available choices and limits instead of using post-submit task status as proof of capability.
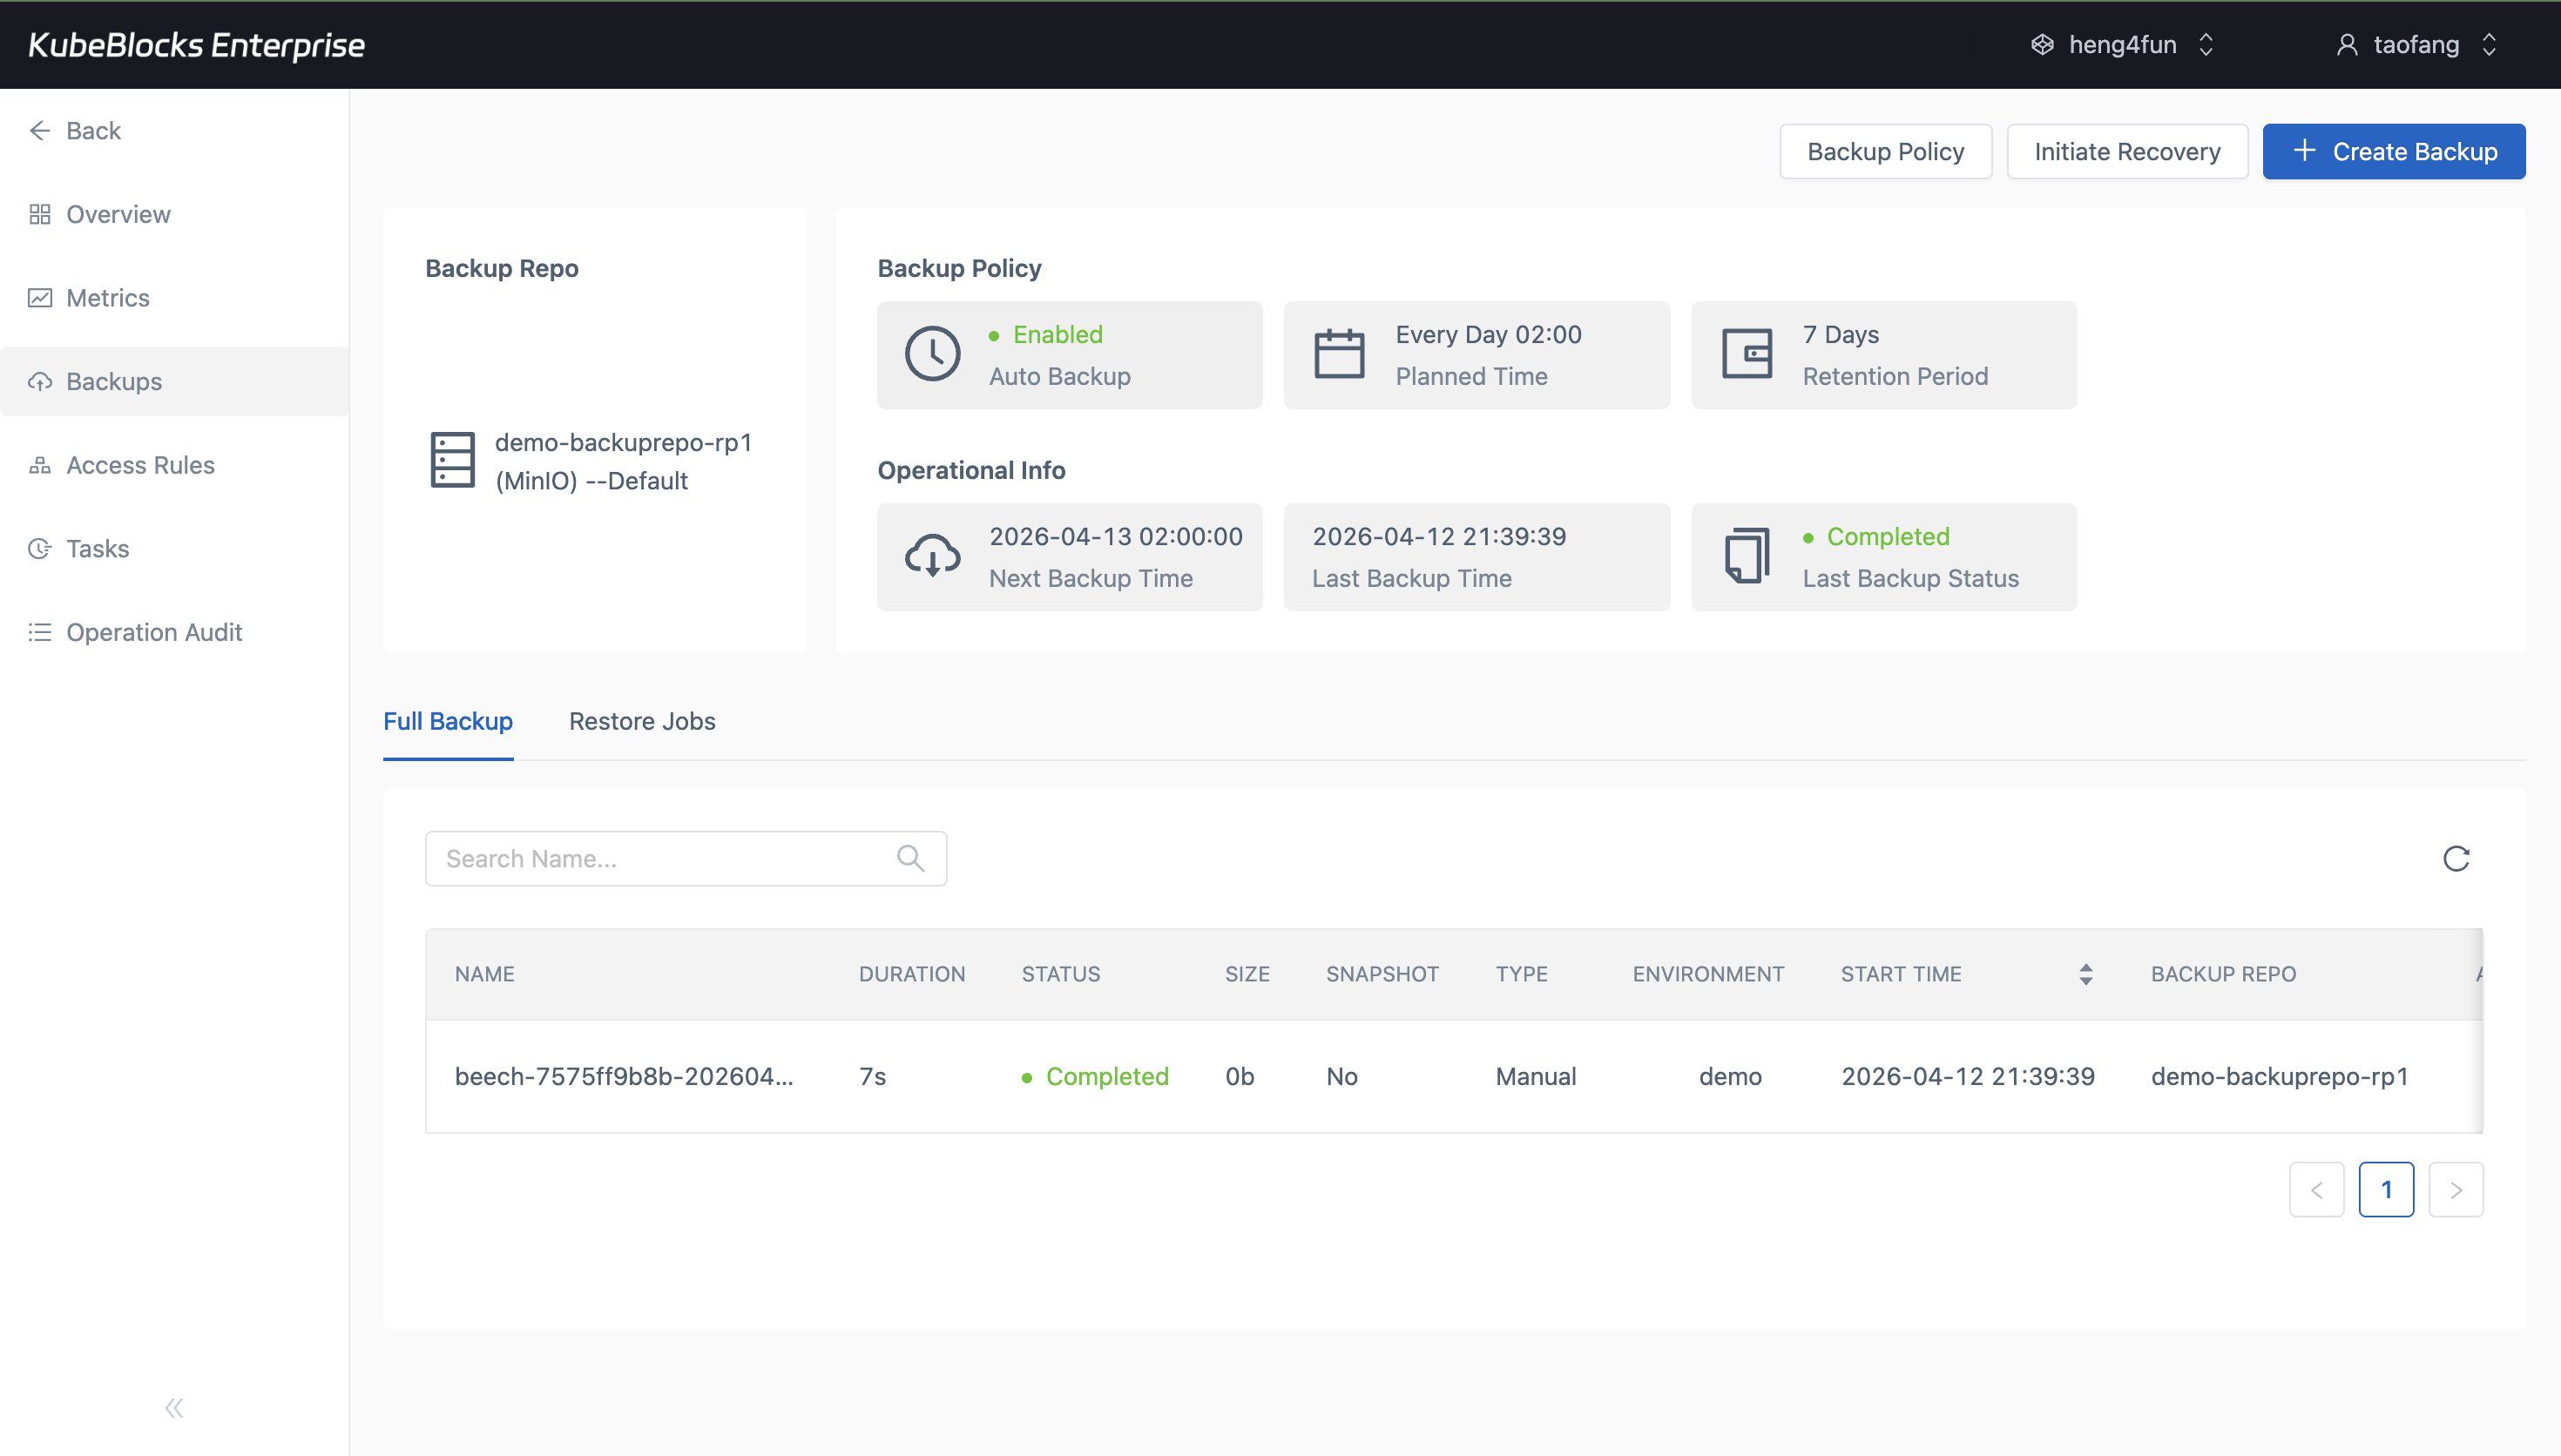
Backup history gives Qdrant teams a real protection point they can use before risky changes or recovery drills.
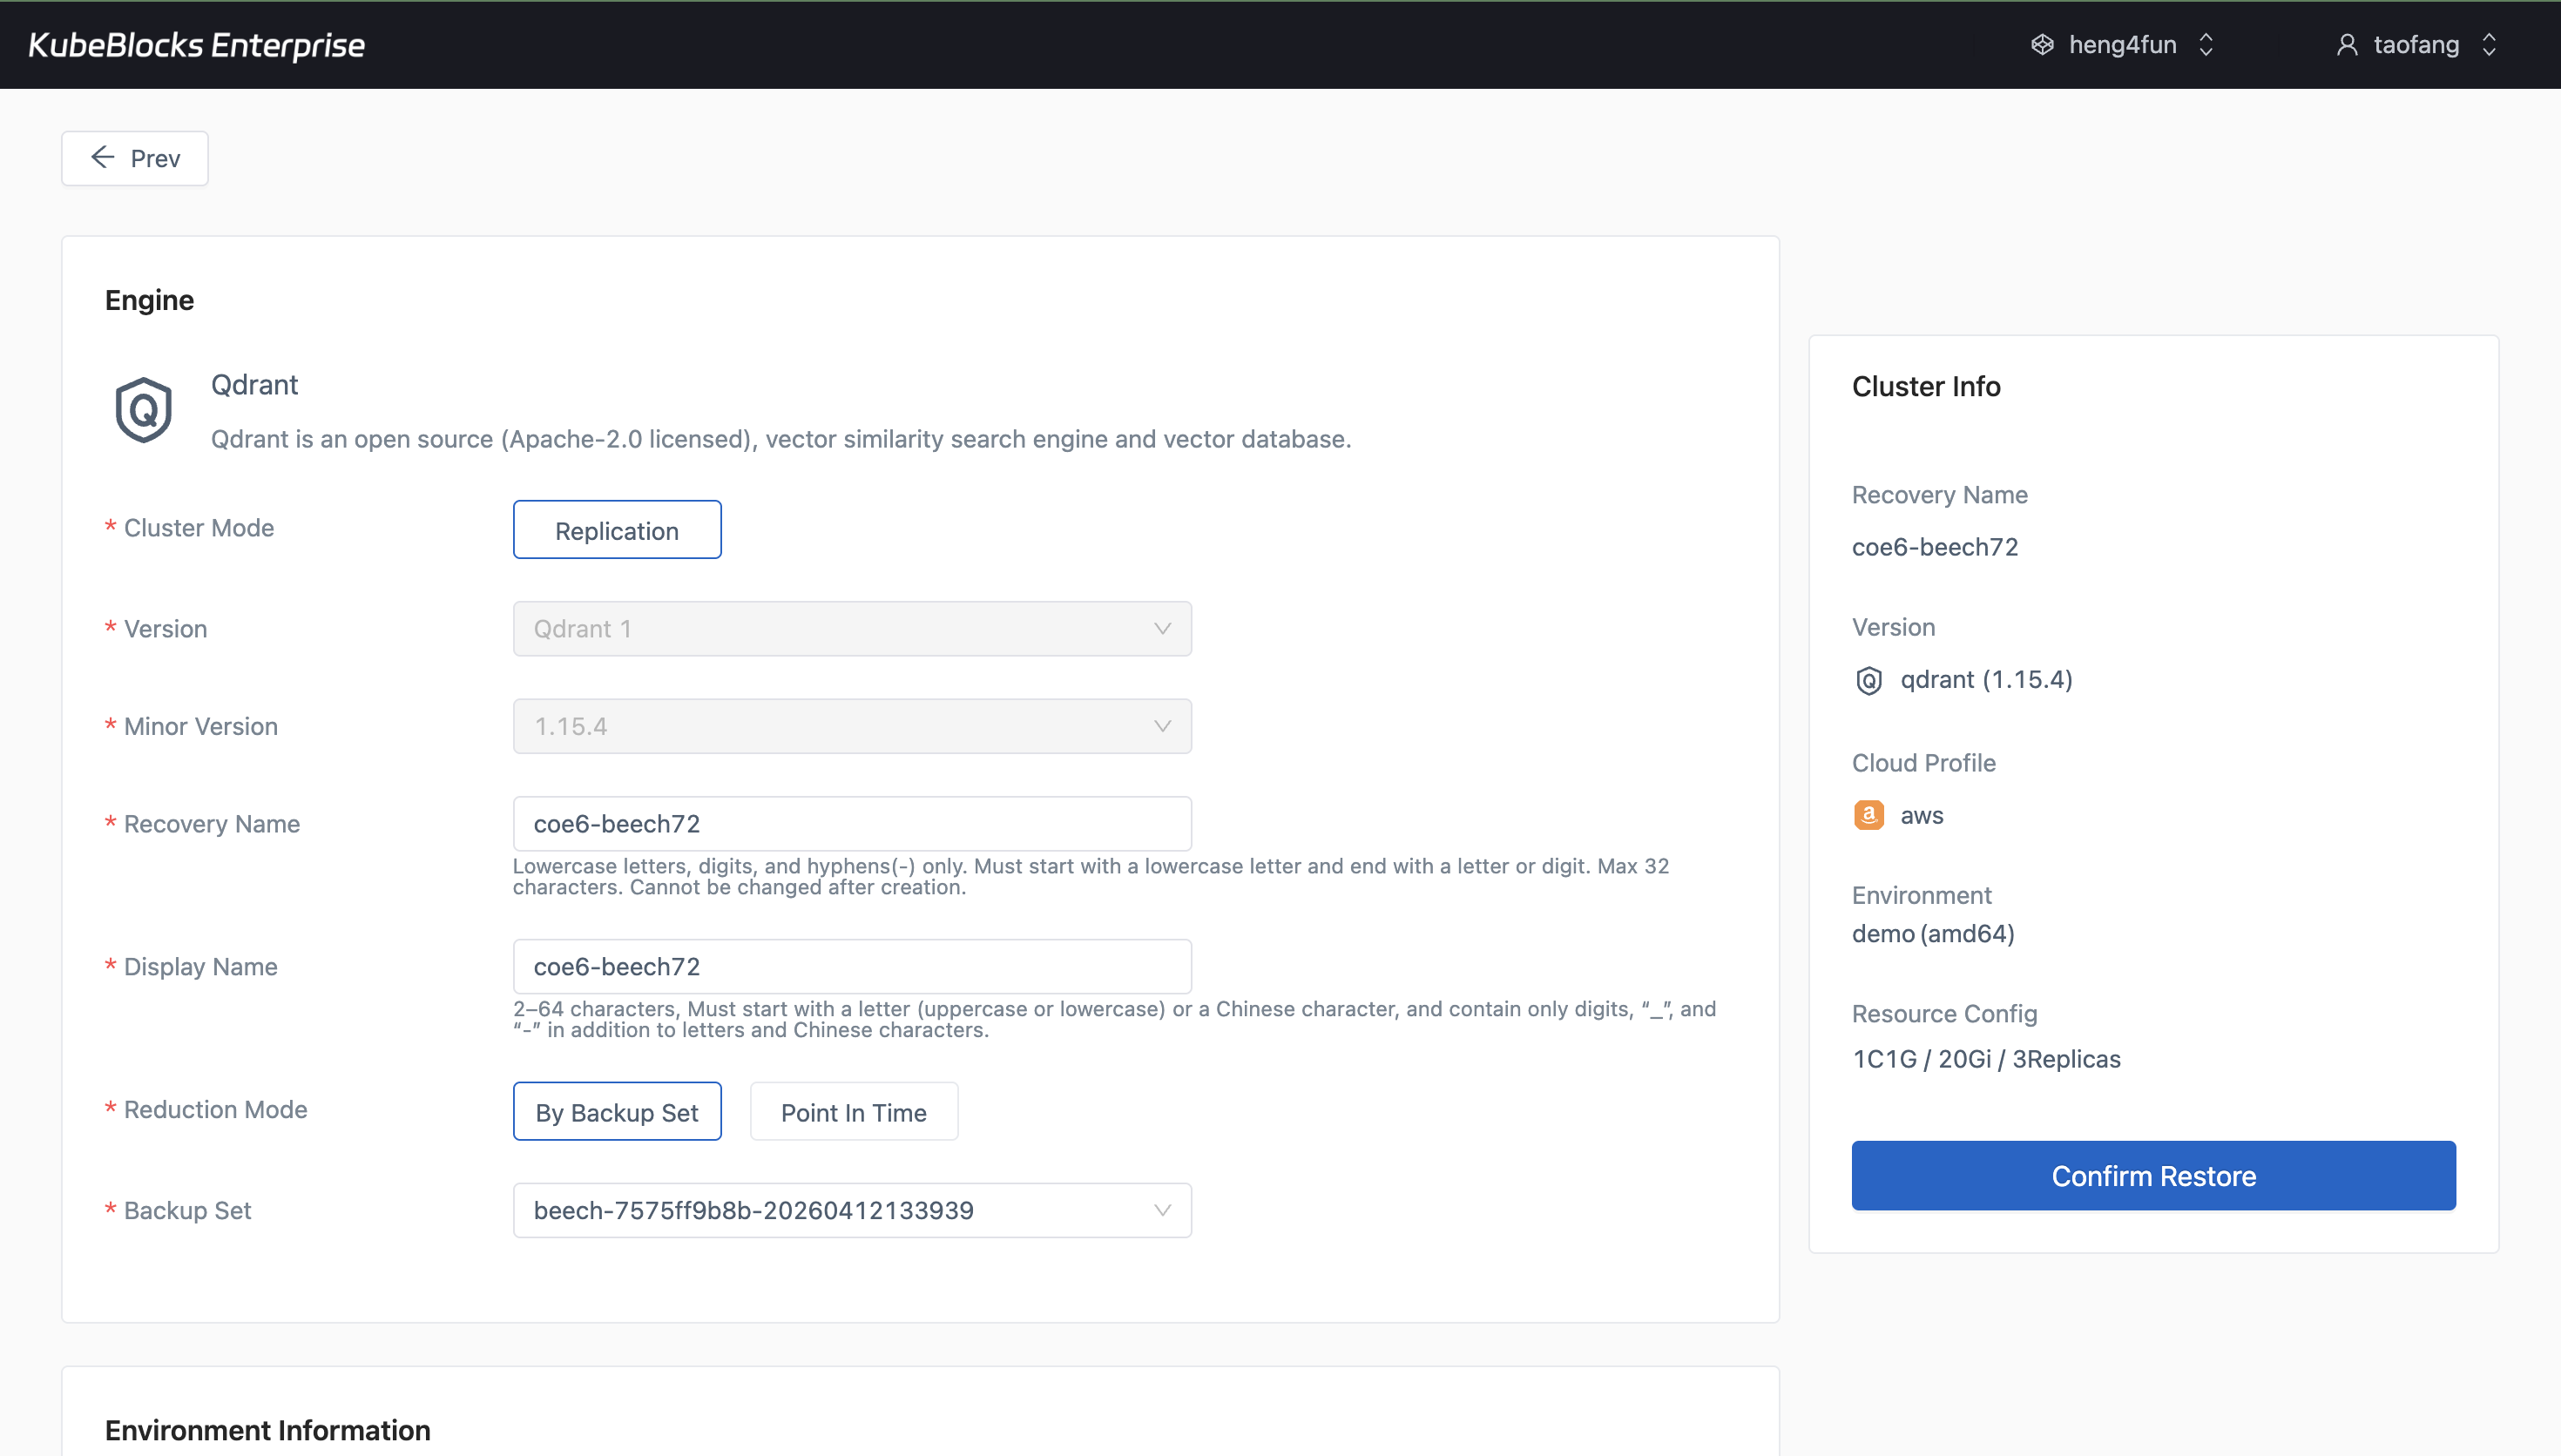
The restore wizard turns an existing Qdrant backup into a guided recovery path for validation and recovery planning.
Protect Qdrant data with backup and restore workflows
Use the Backups page to review protection points and open Restore from a completed backup whenever teams need validation or recovery options.
- Review completed full backups with repository, duration, and status visible in context.
- Open the restore wizard directly from a real Qdrant backup set.
- Keep data protection separate from lifecycle, scaling, and audit workflows.
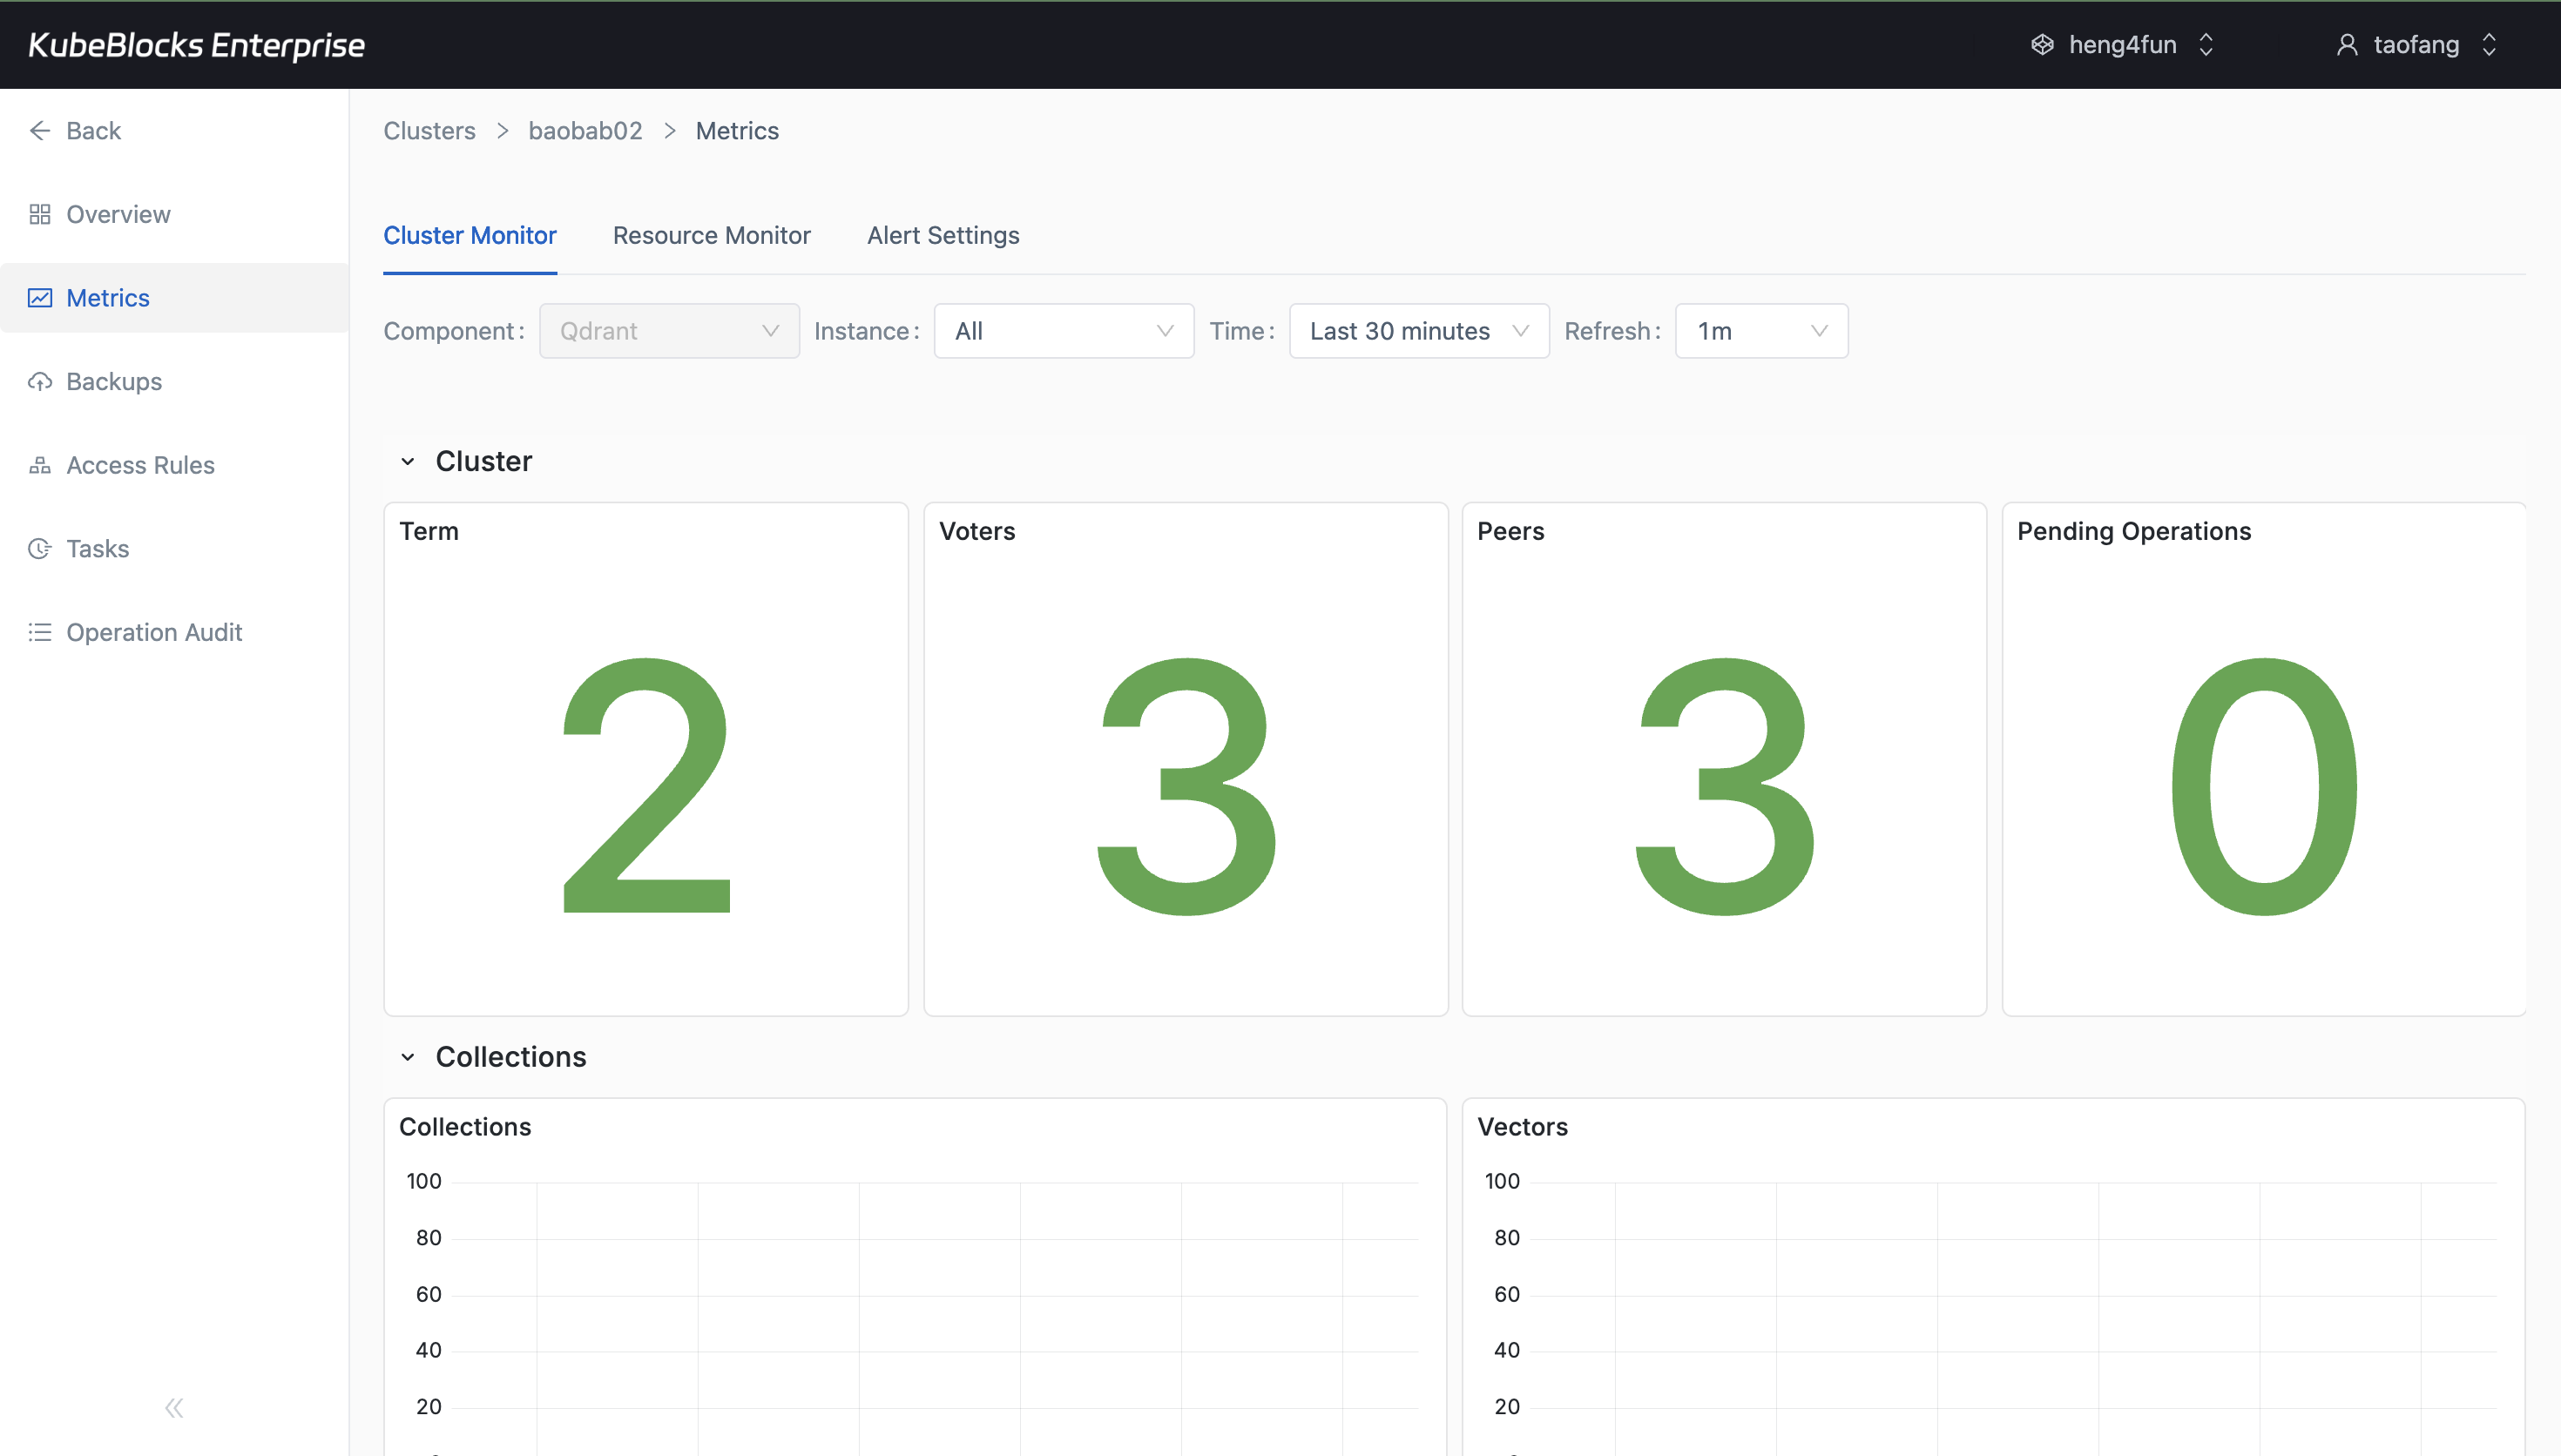
Cluster Monitor gives teams a live view into Qdrant health and service behavior after the charts hydrate.
Track Qdrant service health from Cluster Monitor
Use Cluster Monitor to watch Qdrant behavior and keep service health review close to the same cluster workspace used for lifecycle and scaling actions.
- Monitor Qdrant service metrics after Cluster Monitor finishes loading.
- Keep health review close to lifecycle and scaling actions from the same cluster workspace.
- Use live charts instead of a task-status screen when validating current service behavior.
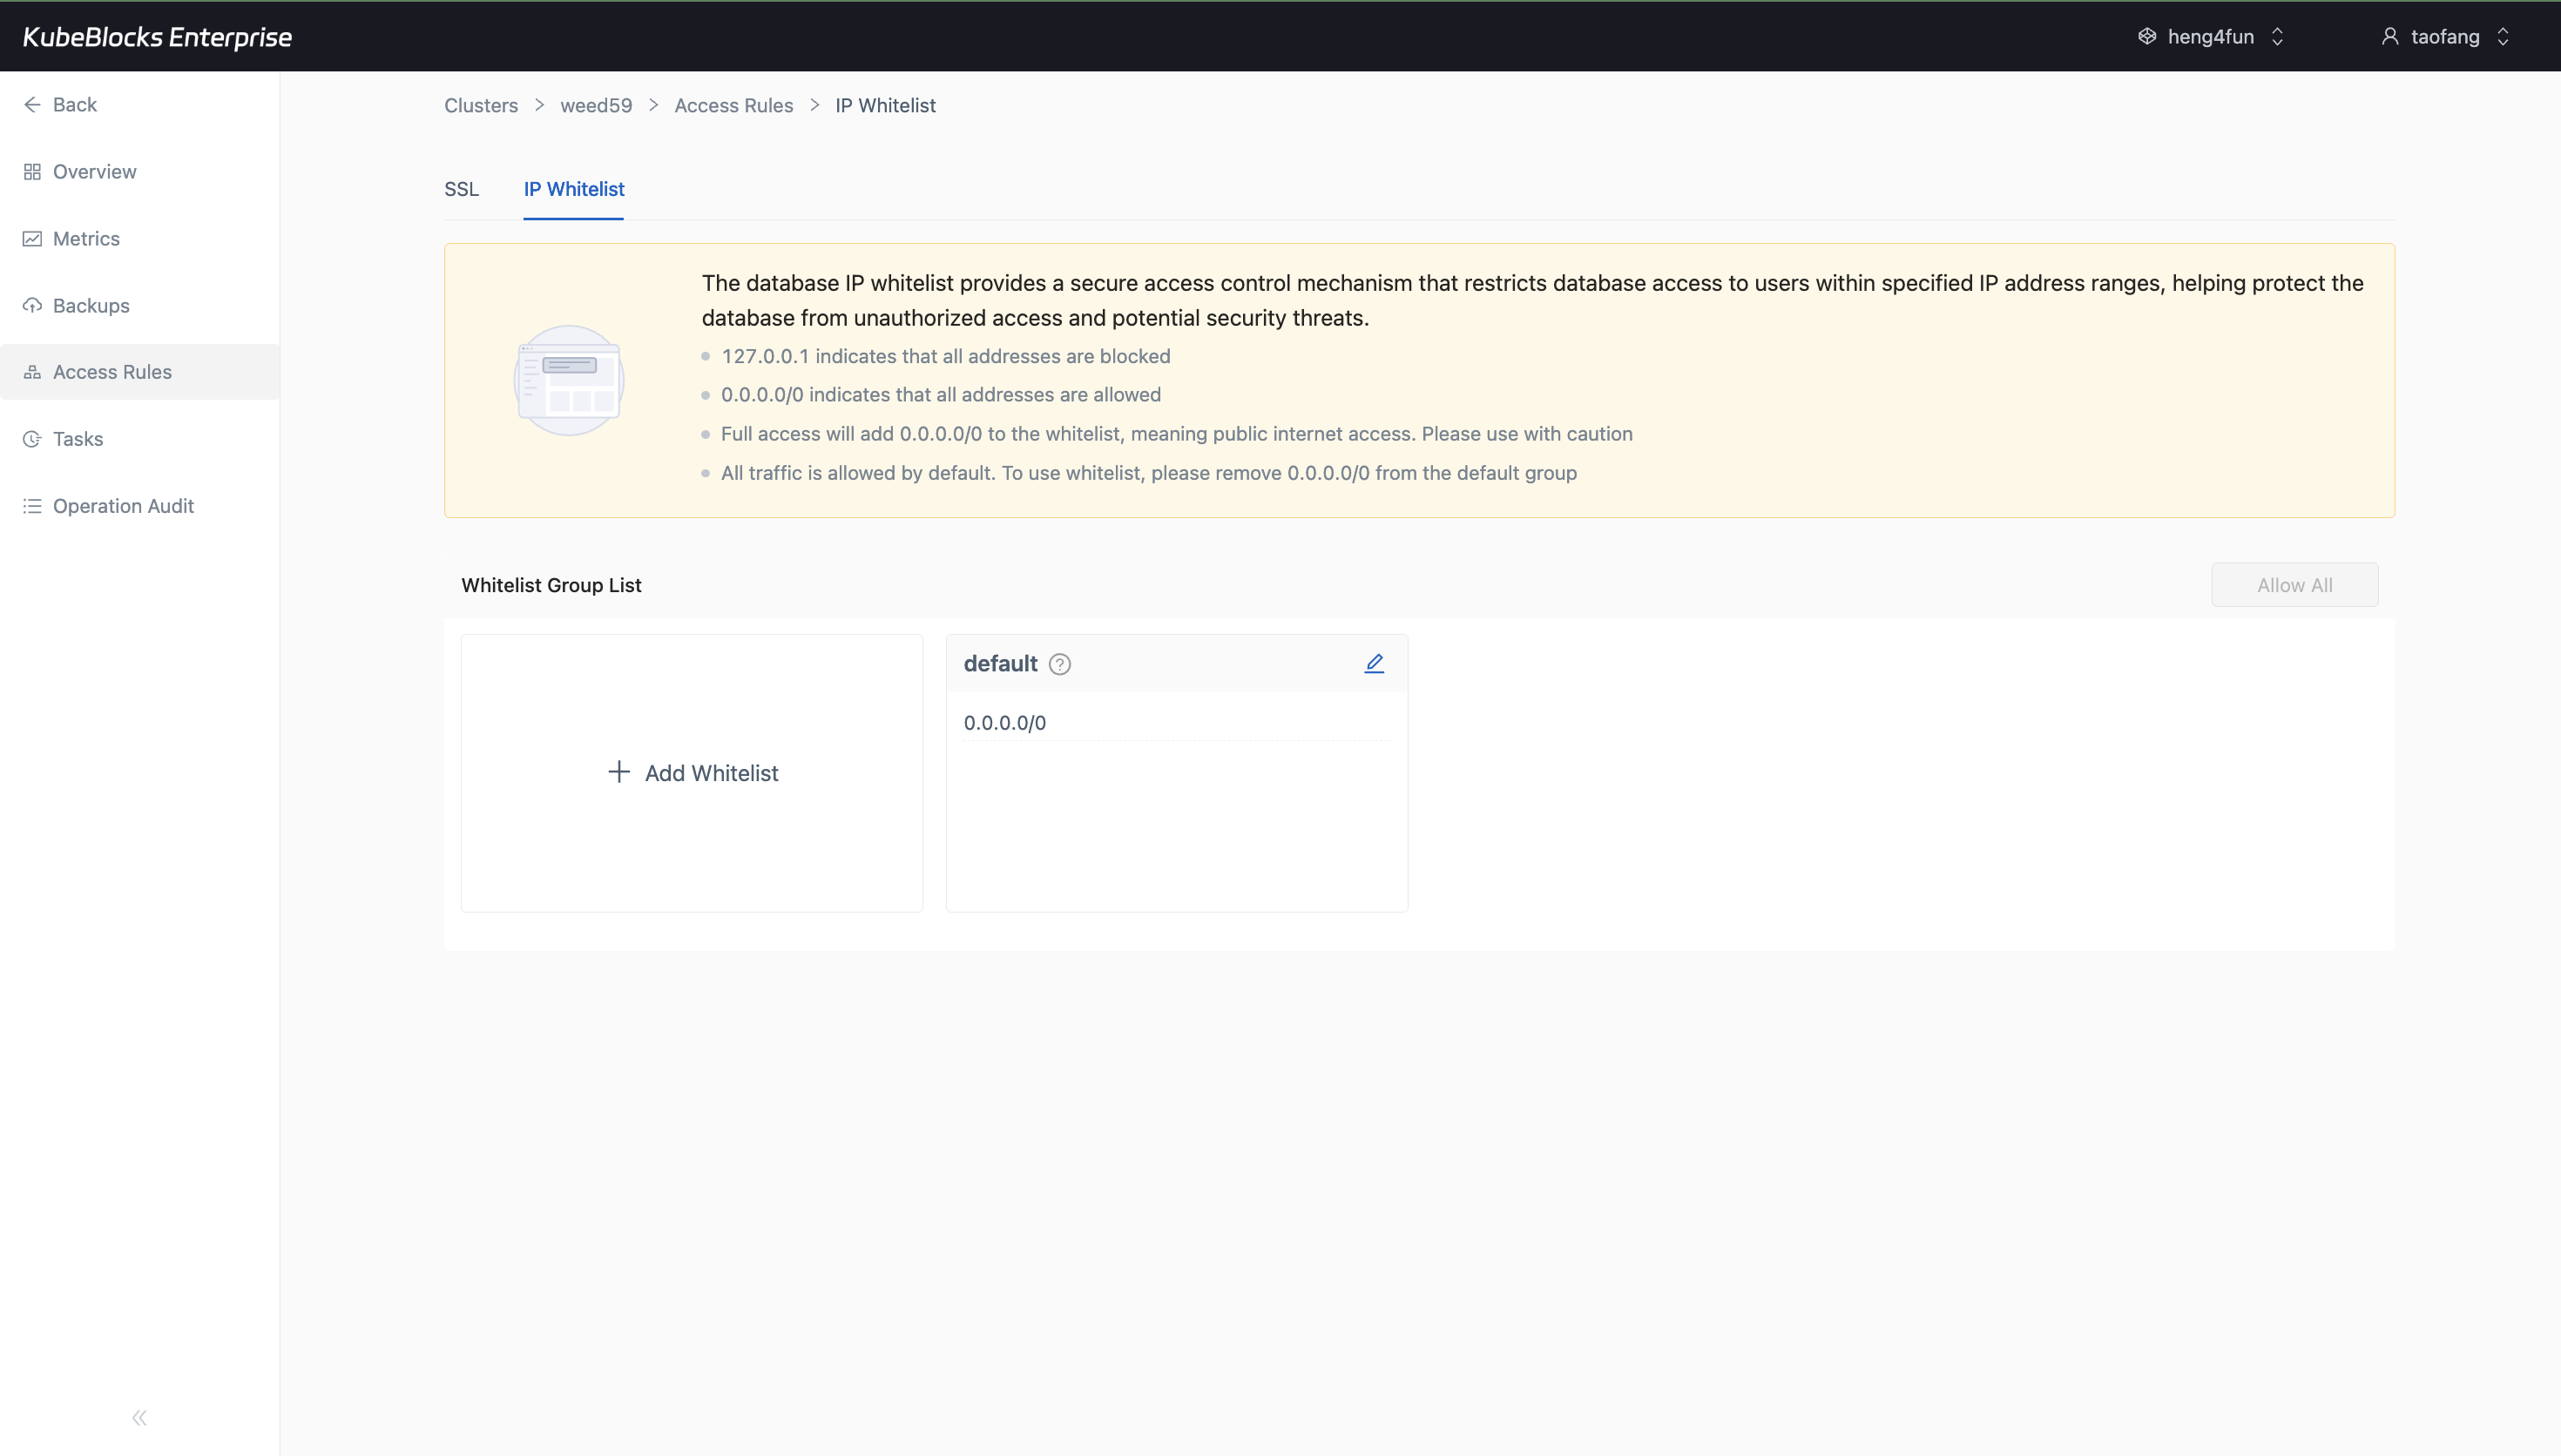
The IP Whitelist page shows the current default group and where users add or tighten source access rules.
Control Qdrant access with IP whitelist groups
Access Rules keeps SSL and IP Whitelist controls together. The IP Whitelist page shows the default group, current CIDR entries, and the actions users use to allow or tighten source ranges.
- Open the IP Whitelist tab directly from the Qdrant cluster workspace.
- Review the default whitelist group and the current `0.0.0.0/0` entry before narrowing source access.
- Add stricter whitelist groups from the same page when users need more controlled network access.
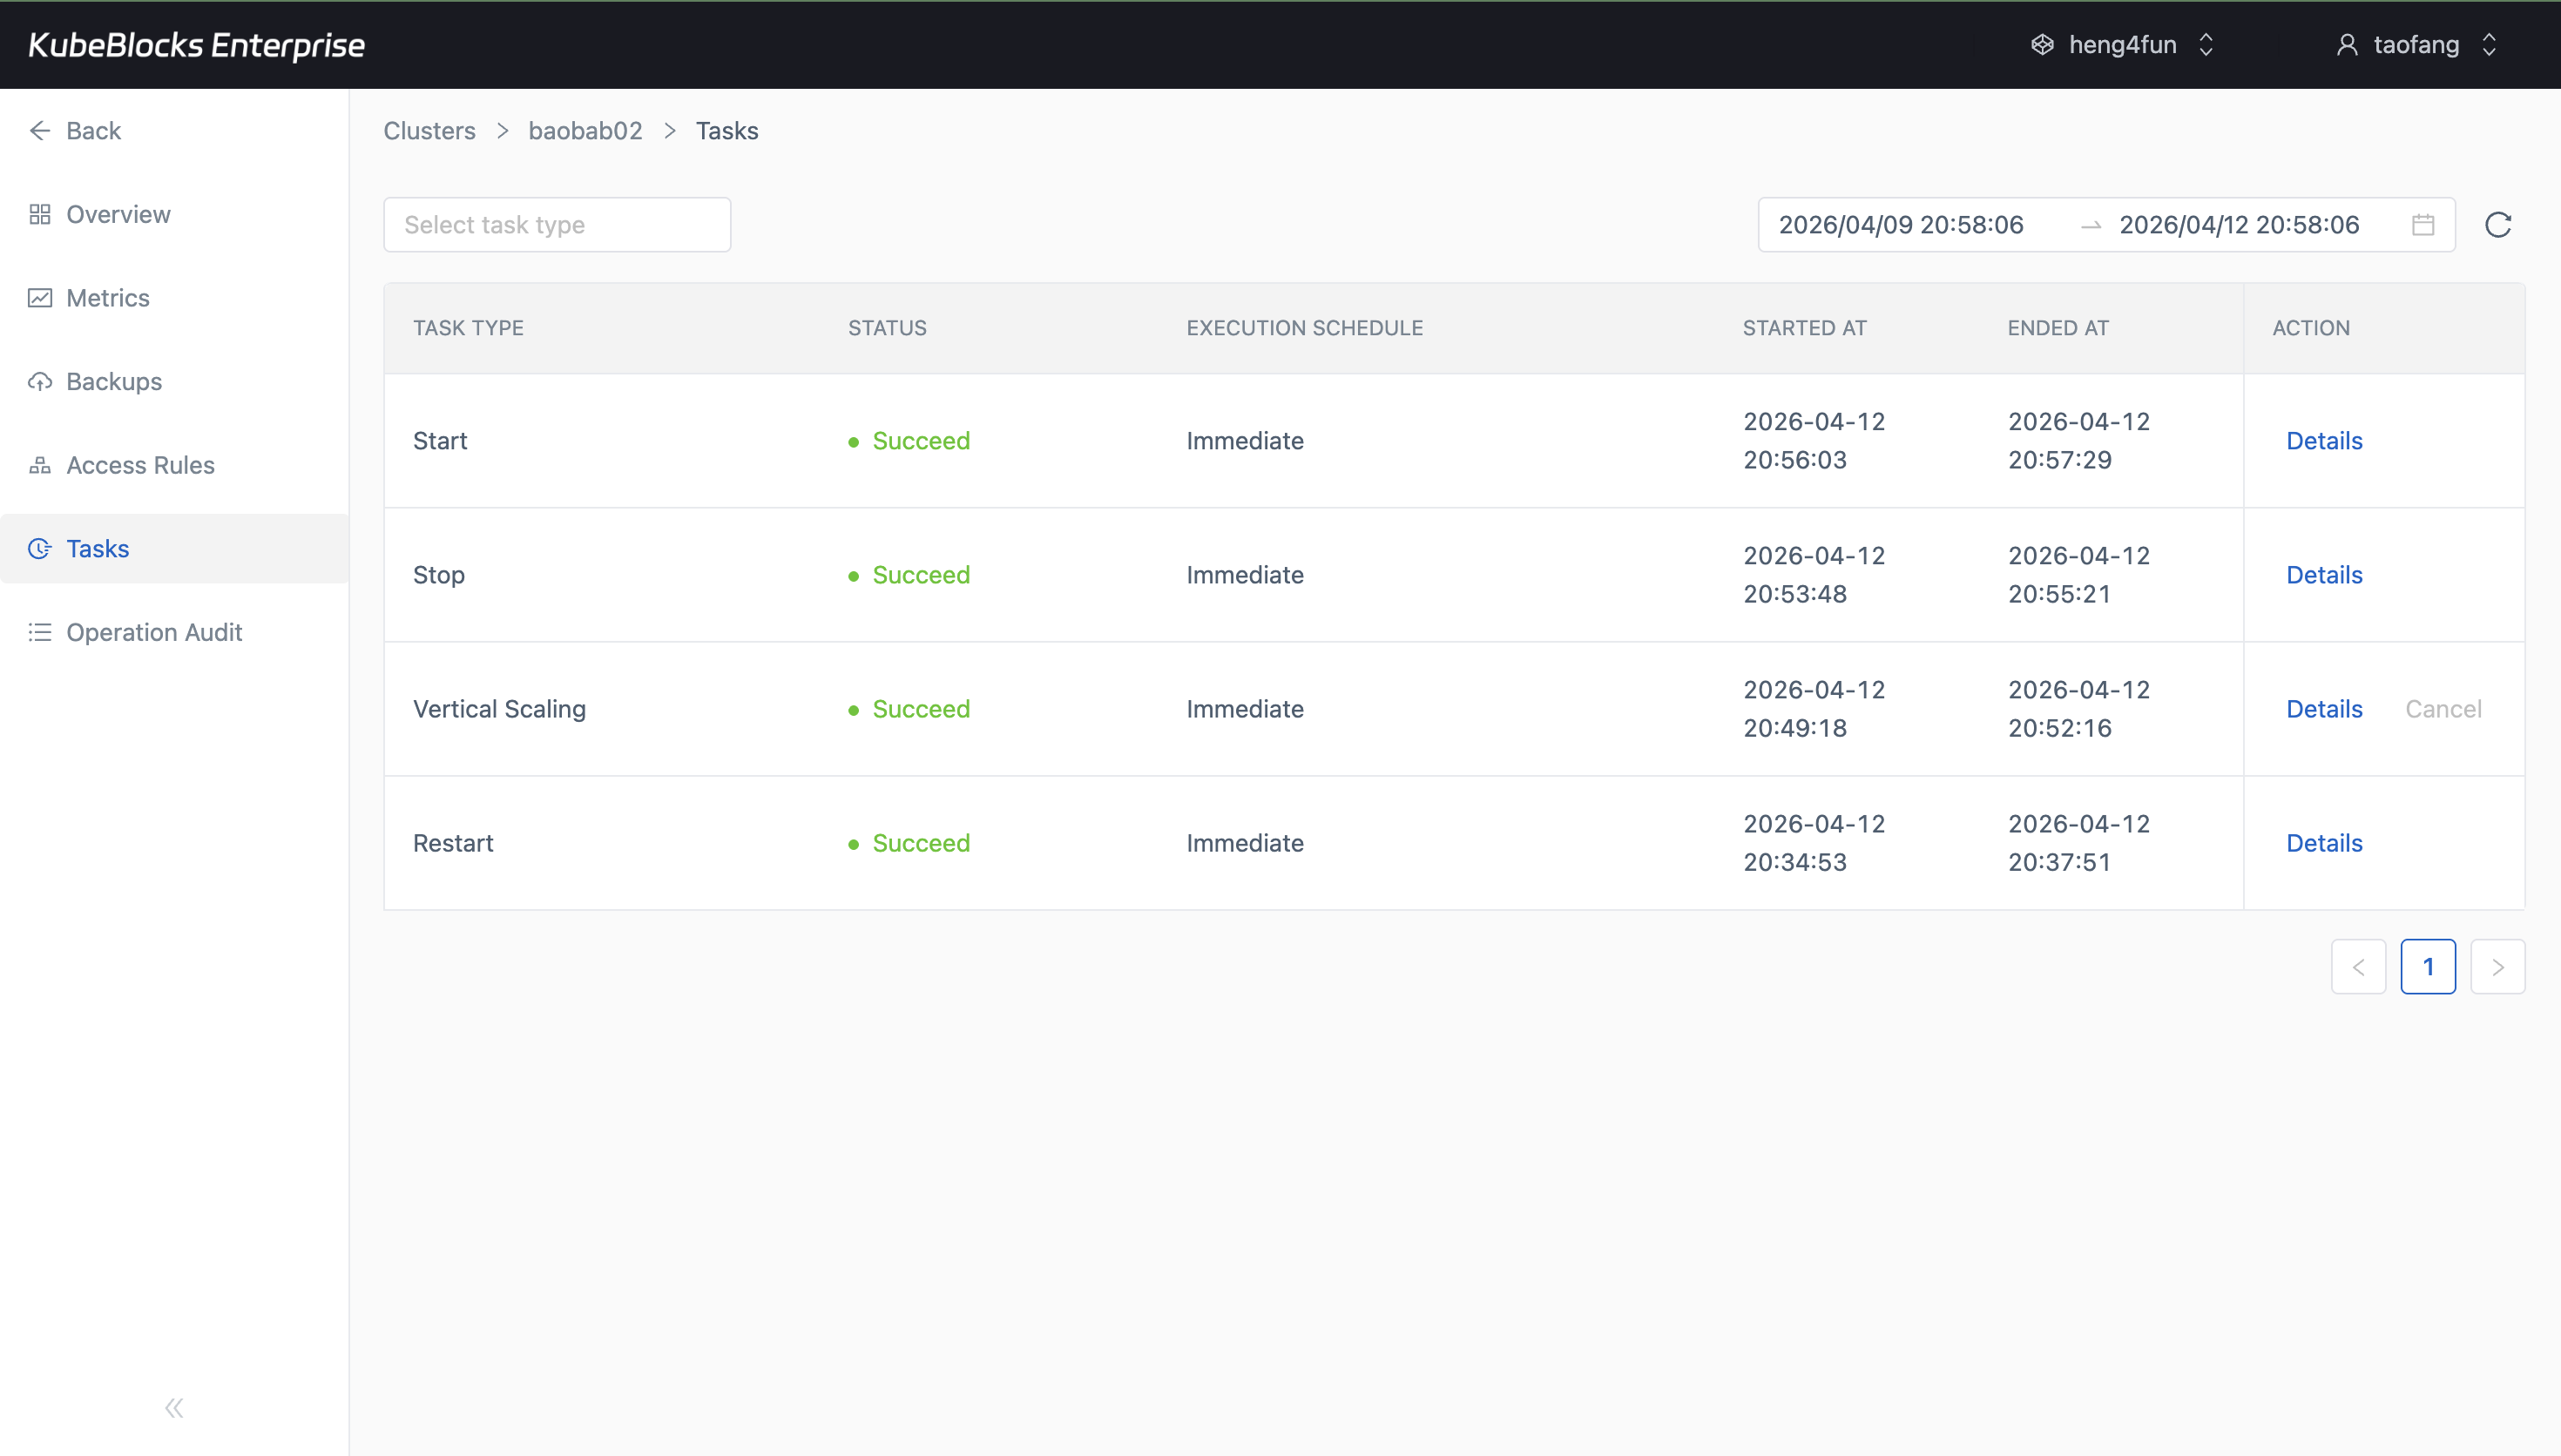
Task history gives teams a practical audit trail for Qdrant lifecycle and capacity changes.
Review Qdrant operational history from task records
Task history keeps restart, scaling, stop, and start changes traceable so teams can see what happened before handing the service back to users.
- Review lifecycle and scaling outcomes from one timeline instead of piecing together change history from multiple pages.
- Use task records as evidence that a Qdrant day-2 operation completed successfully.
- Keep change tracking separate from metrics and backup workflows.
Ready to build your own DBaaS on Kubernetes?
Talk to our team and see how KubeBlocks Enterprise can help you consolidate databases, strengthen security, and reduce operational costs.