
KubeBlocks for
InfluxDB
InfluxDB is a purpose-built time-series database optimized for high-write and high-query workloads. It excels at IoT monitoring, real-time analytics, and DevOps observability with its powerful query language and built-in data retention policies.
Supported versions
Available on
 AWS
AWS Azure
Azure GCP
GCP OCI
OCI Alibaba Cloud
 Rancher
 OpenShift
Databases
 MySQL
MySQL PostgreSQLOracle
 SQL Server
 Redis
Redis MongoDB
 ClickHouse
Vector & AI
 Qdrant
 Milvus
 Elasticsearch
Message queues
 RocketMQ
 RabbitMQ
 Kafka
KafkaOthers
 VictoriaMetrics
 InfluxDB
 etcd
etcd ZooKeeper
Extend database engines like plug-ins
KubeBlocks provides unified database operations through its addon-based architecture. With KubeBlocks Enterprise, access over 15 seamless integrations to scale your database services.
One control plane, consistent operations across all engines — powered by the addon mechanism.
Run InfluxDB with guided lifecycle, tuning, observability, and data workflows
Operate InfluxDB with a rich create wizard, dedicated compute and storage scaling dialogs, parameter tuning, live metrics, runtime logs, IP whitelist controls, task history, and a public InfluxDB UI data-management workflow backed by real KubeBlocks Enterprise evidence.
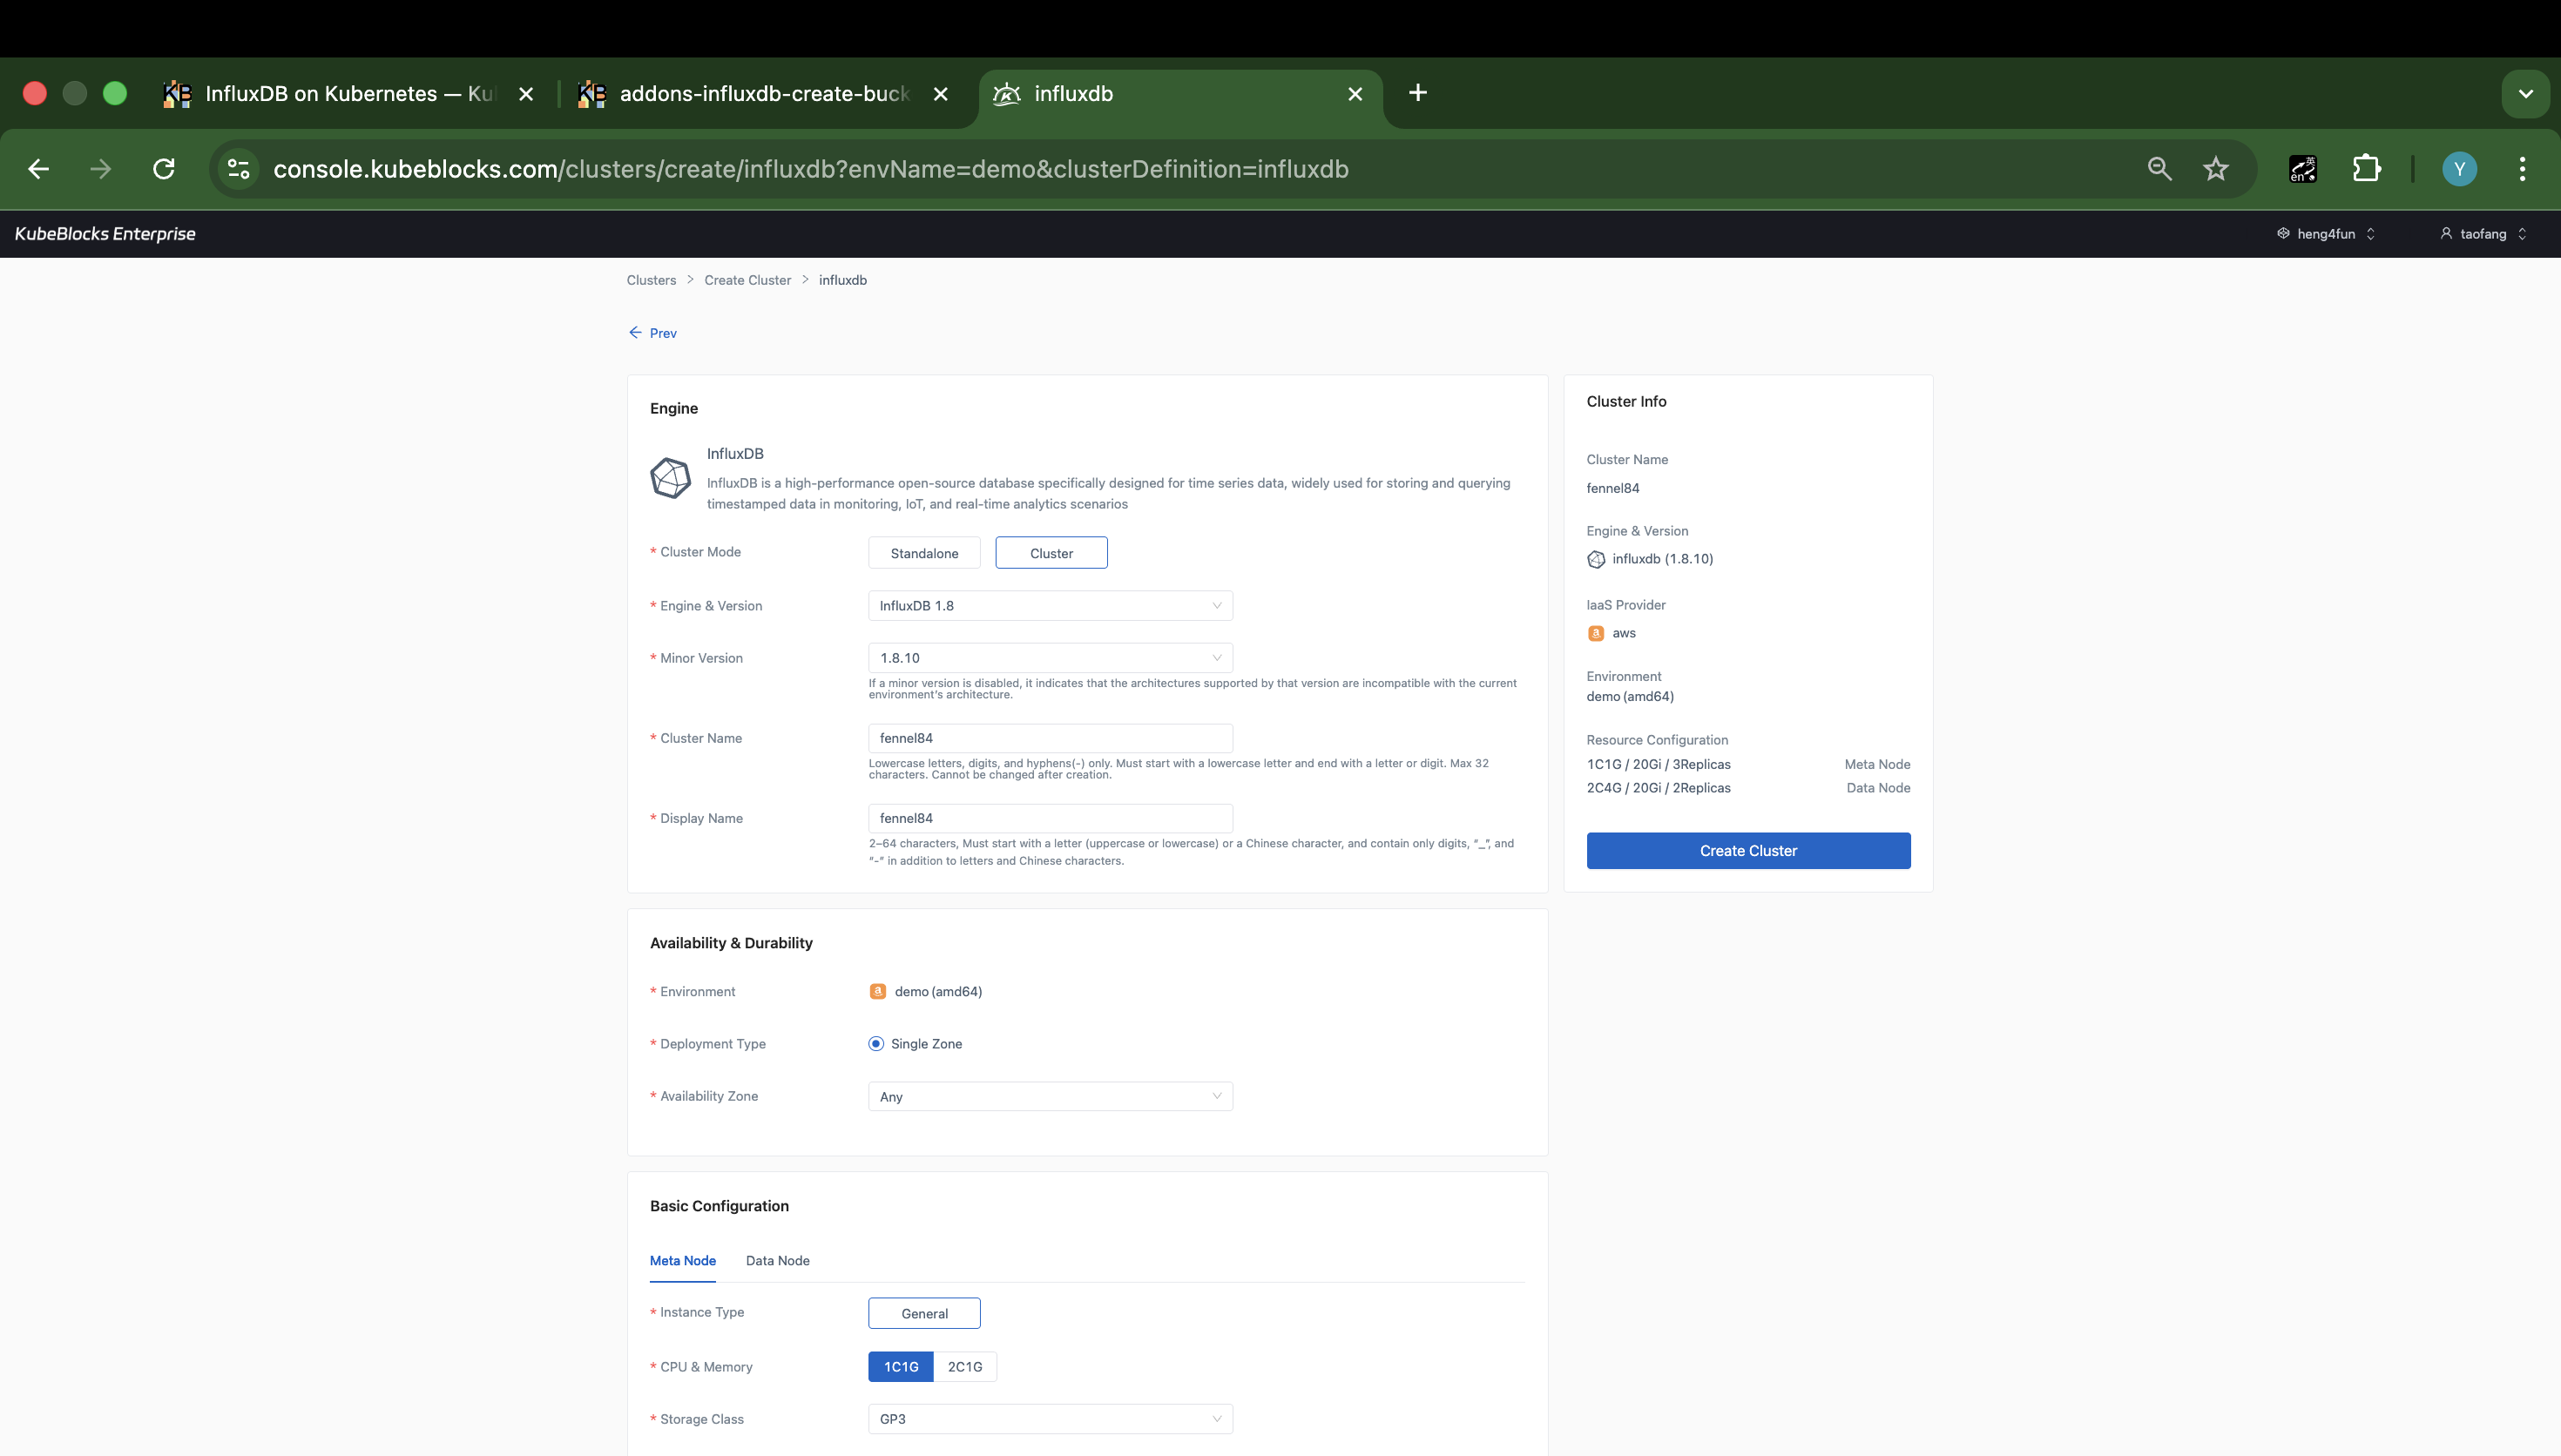
The create wizard keeps InfluxDB deployment mode, component sizing, storage, version, and environment choices visible before provisioning.
Create InfluxDB deployments with standalone and cluster choices visible
Launch InfluxDB from a guided create wizard that keeps deployment mode, engine version, environment, Meta Node sizing, Data Node sizing, storage class, storage size, replica counts, and cluster summary visible before provisioning begins.
- Review the real InfluxDB create wizard with both `Standalone` and `Cluster` deployment choices visible.
- Keep Meta Node and Data Node sizing, storage, and replica controls in the same workflow as version and environment selection.
- Confirm the generated cluster summary before the deployment moves into day-2 operations.
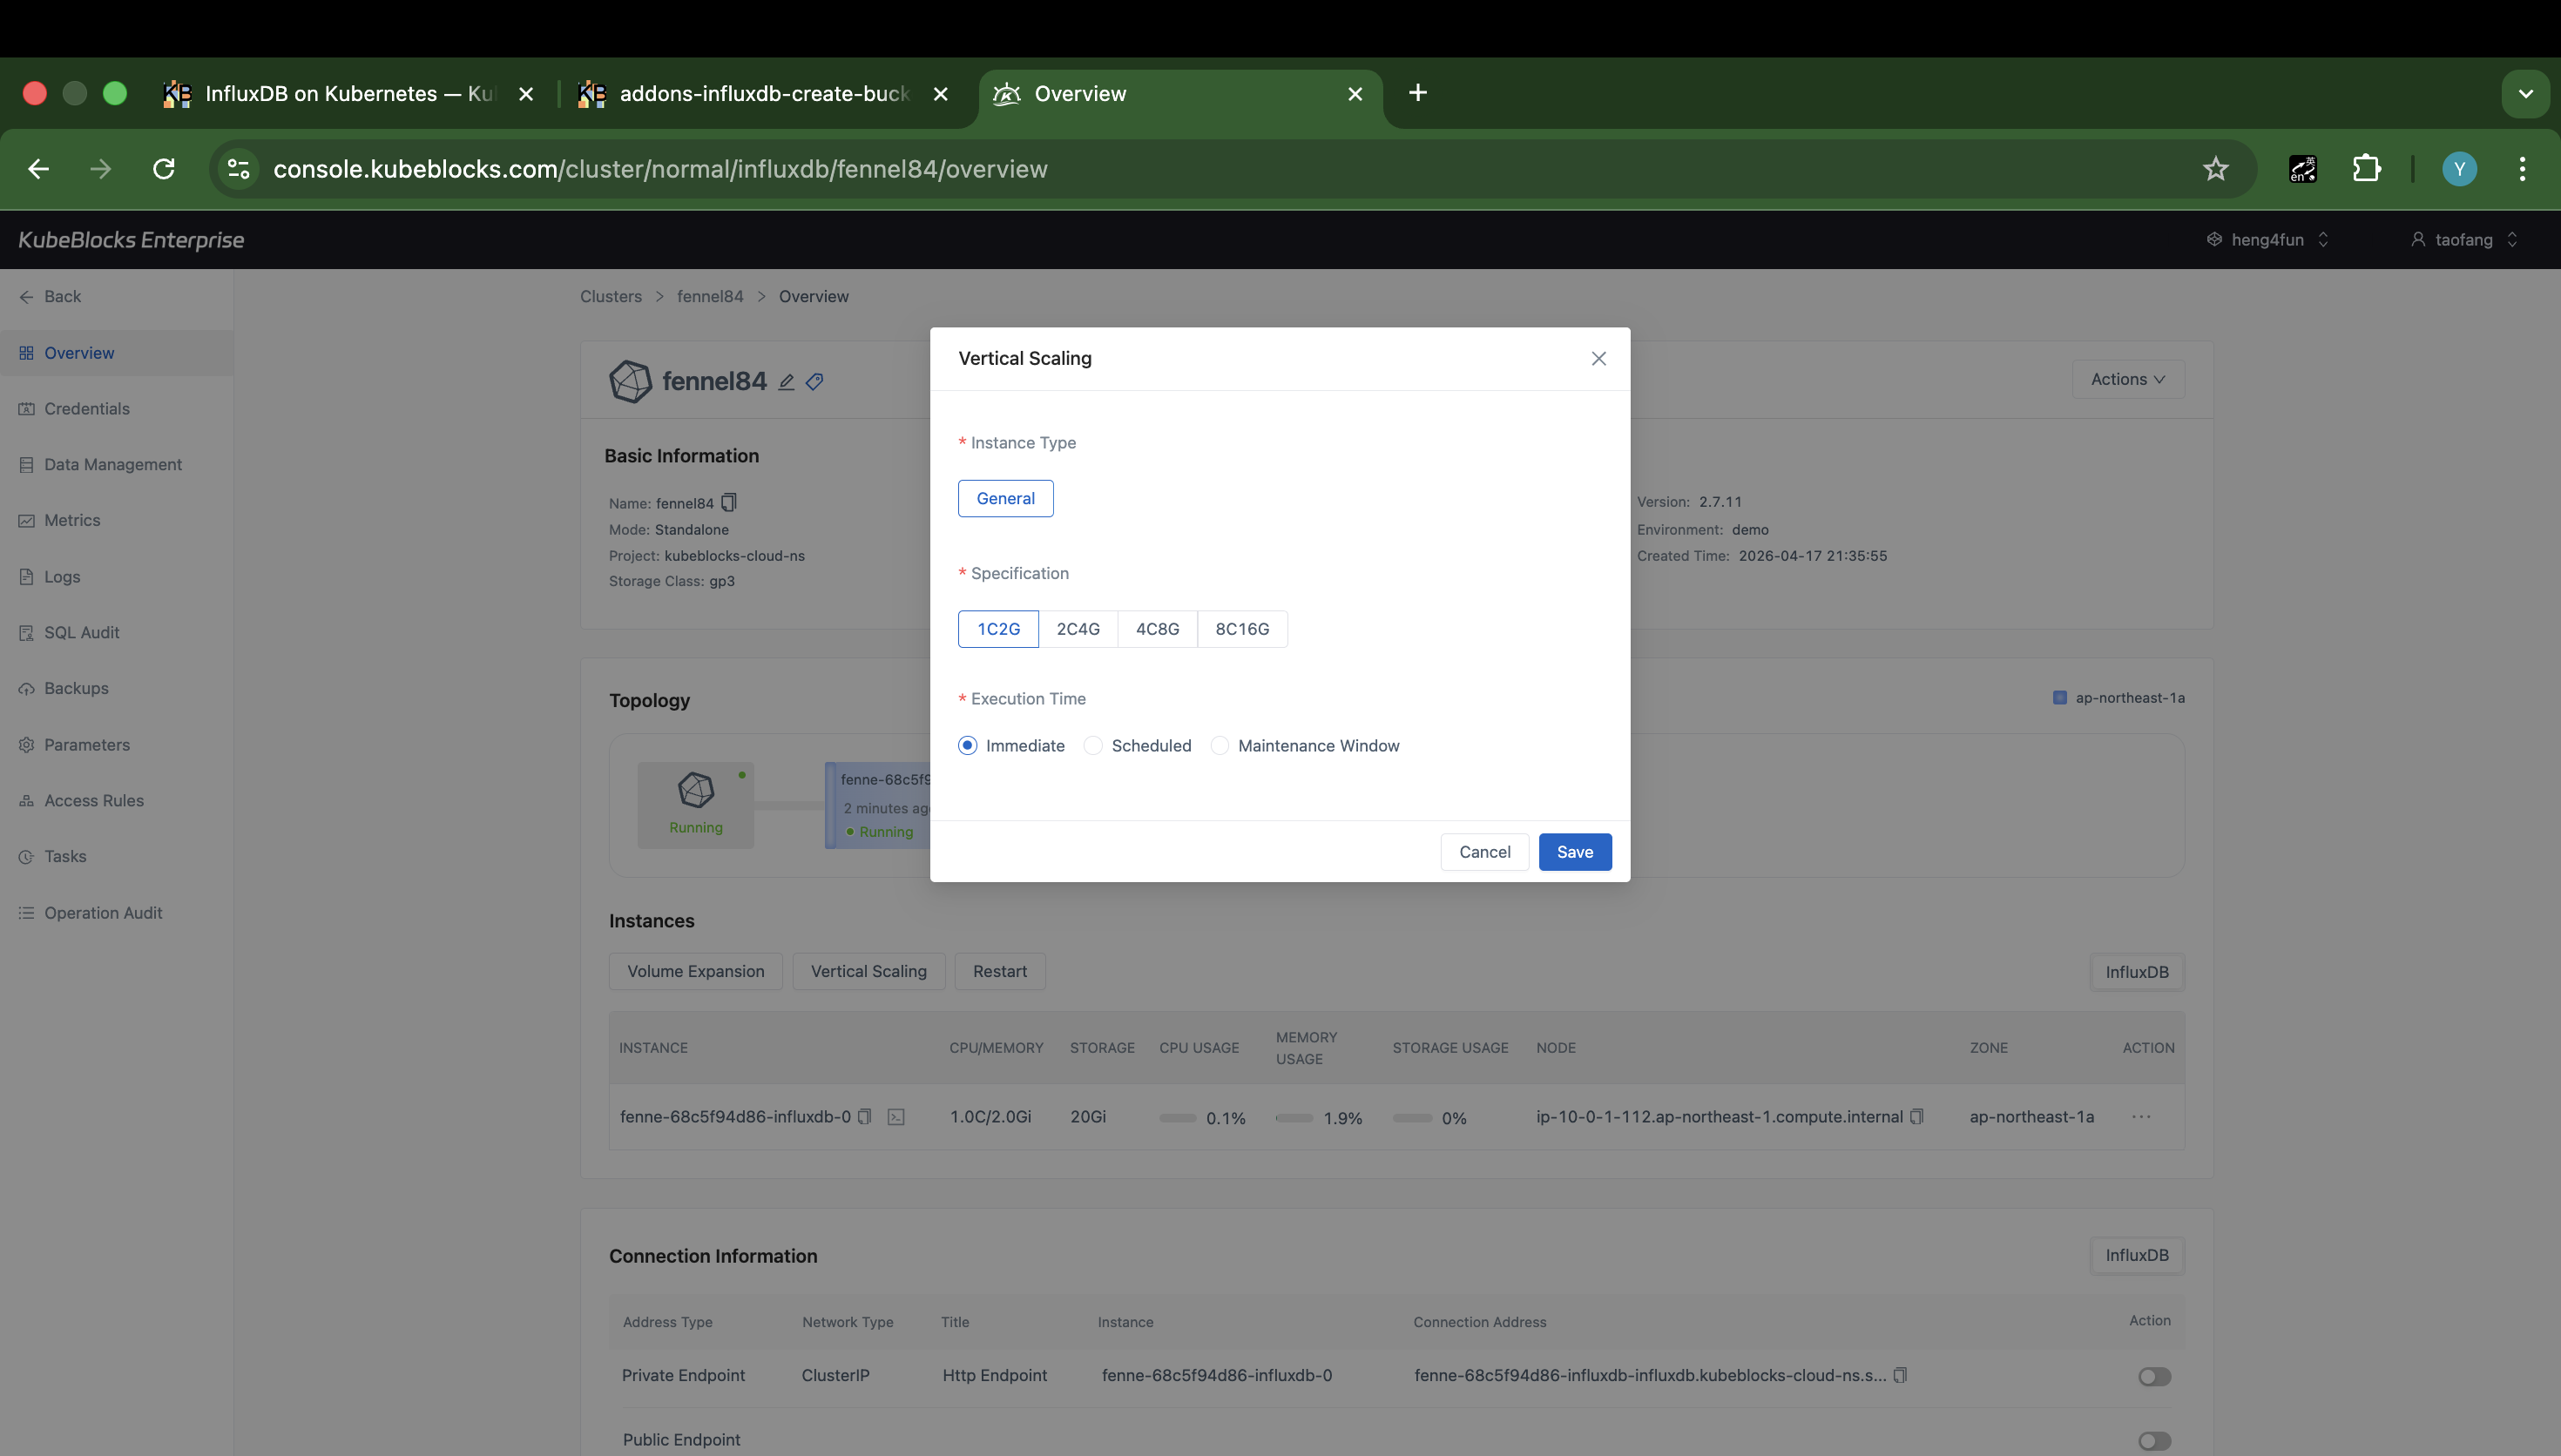
Vertical Scaling shows InfluxDB compute choices and execution timing before users save a resource change.
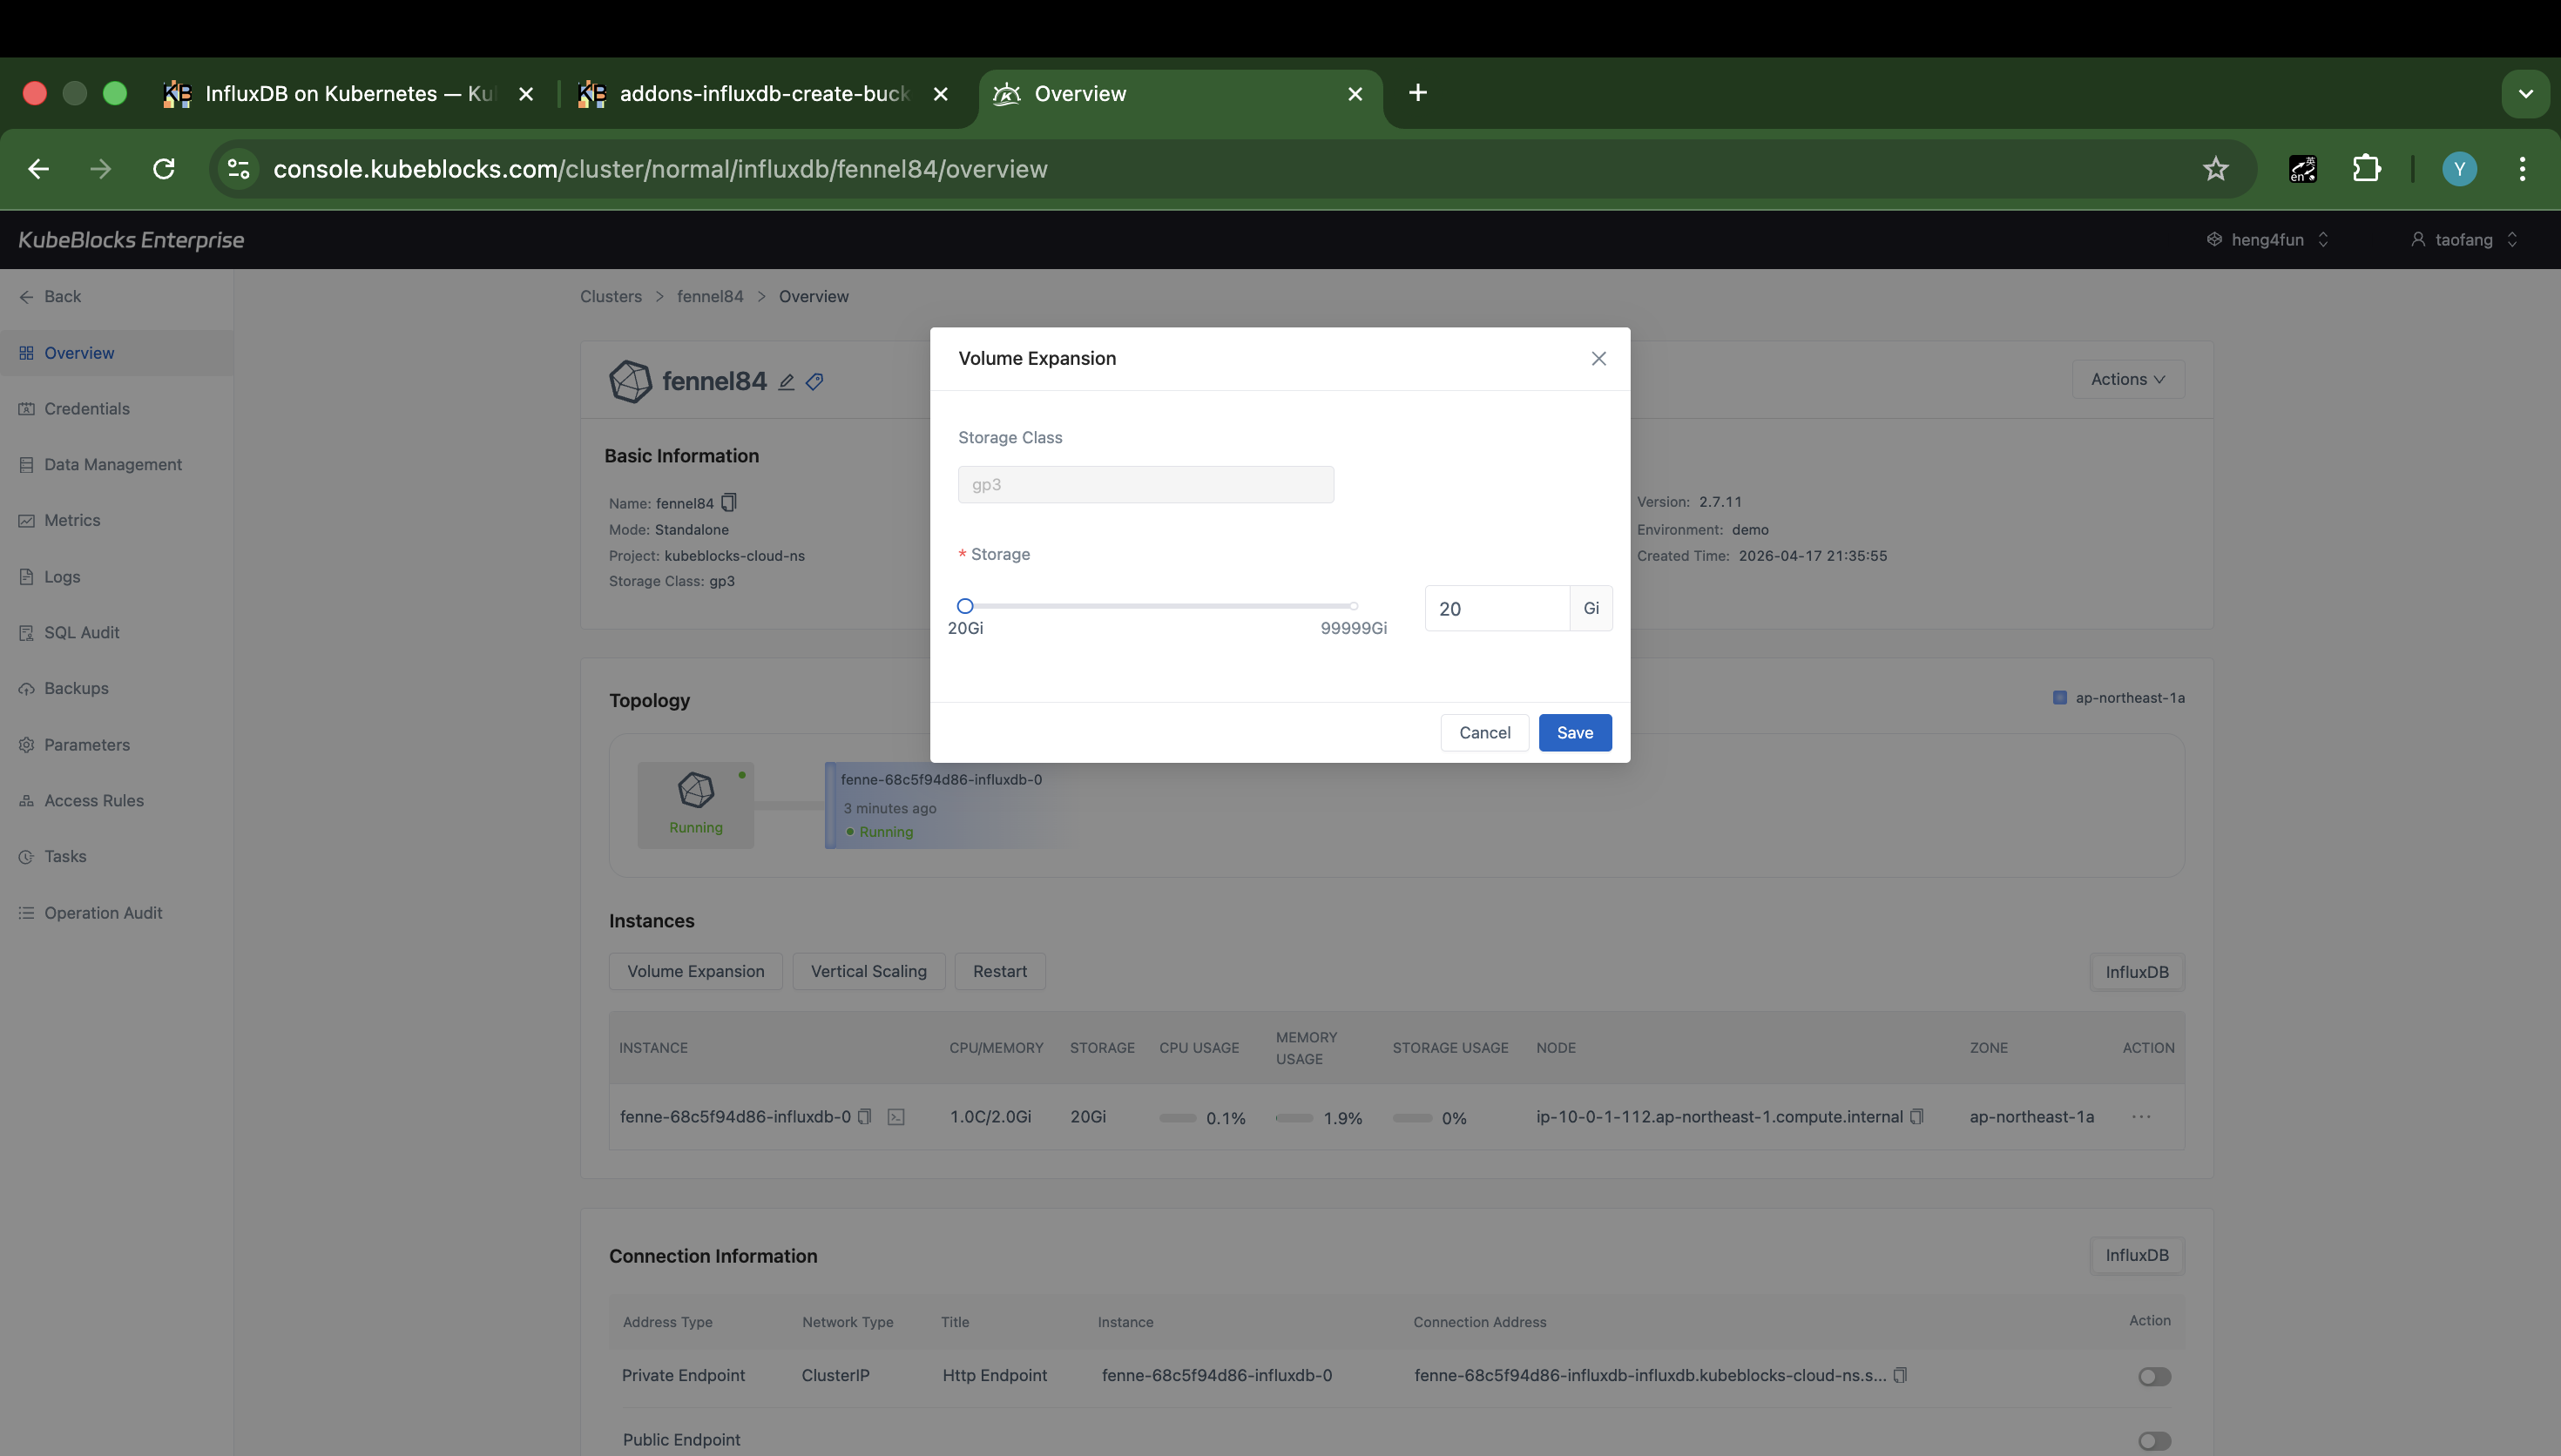
Volume Expansion keeps the storage class, current capacity, target capacity, and save action visible in one dialog.
Resize InfluxDB compute and storage from dedicated dialogs
Vertical Scaling and Volume Expansion keep CPU, memory, and disk growth separate from generic task-state views, so users can review the real change controls before submitting an operation.
- Use Vertical Scaling to compare InfluxDB CPU and memory profiles before applying a compute update.
- Use Volume Expansion to review the storage class, current capacity, and target capacity before growing disks.
- Keep scaling evidence focused on the pre-submit dialogs instead of post-submit task status.
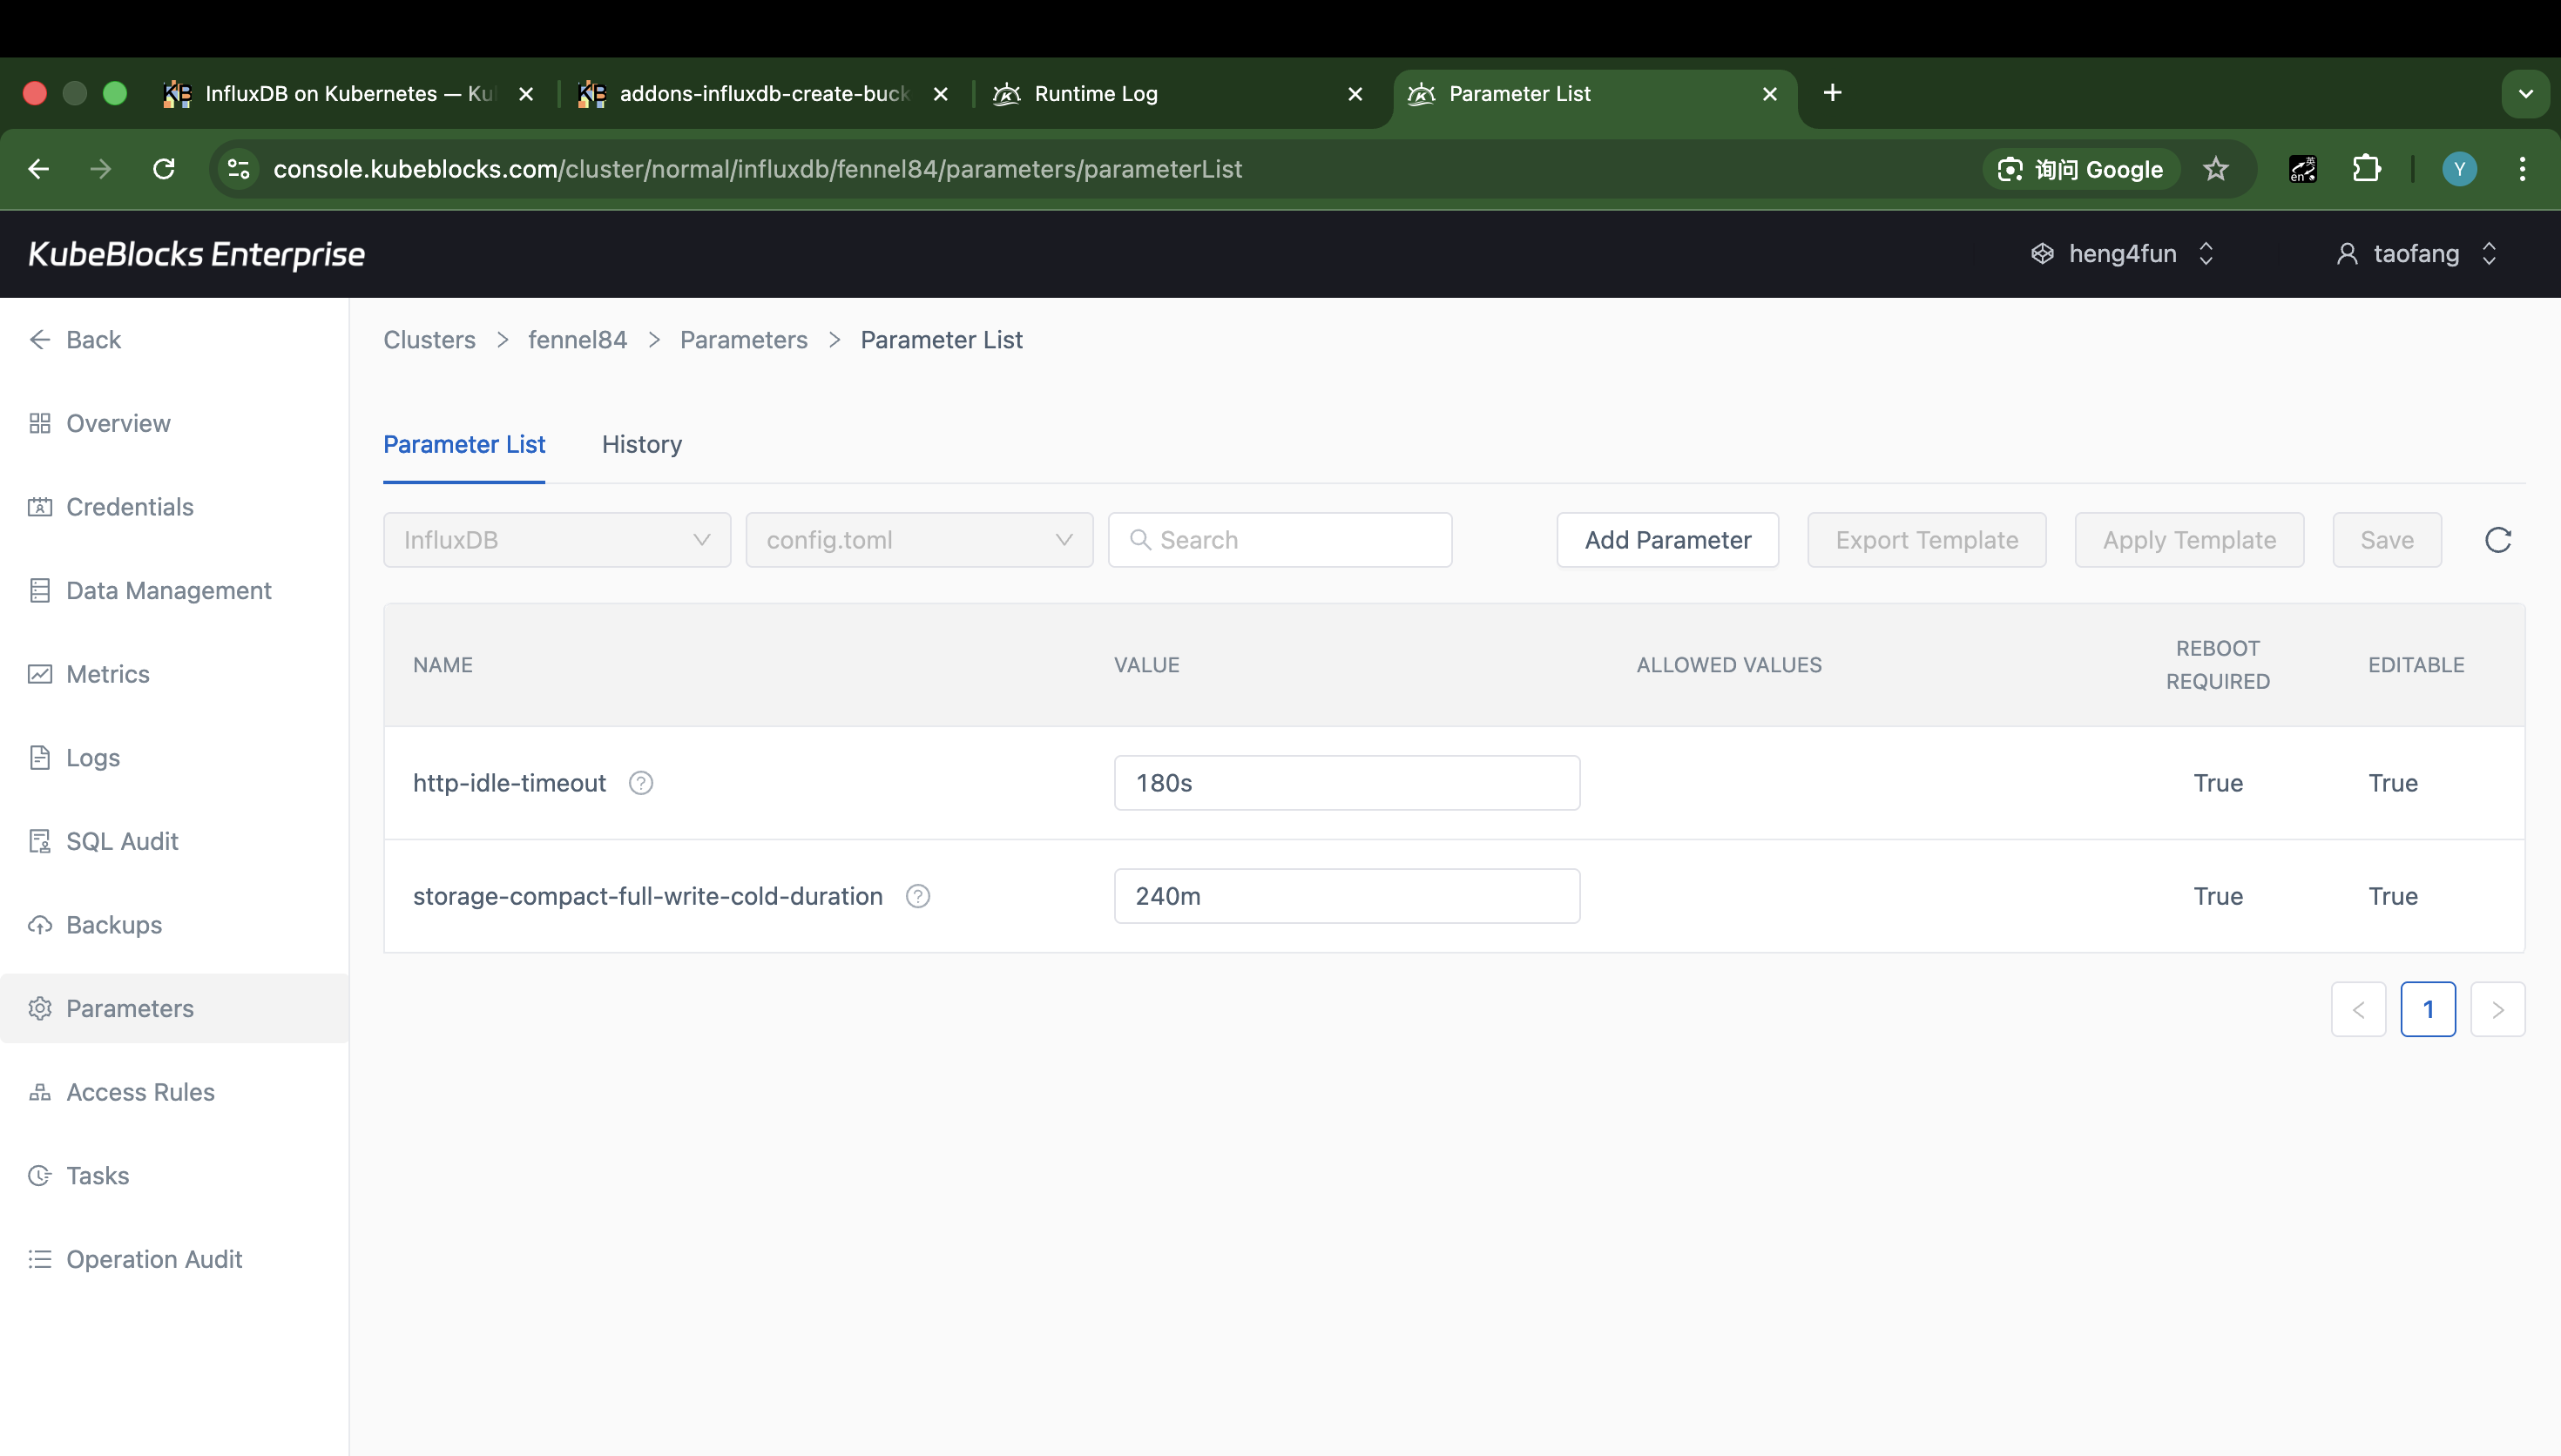
The parameters workspace gives users a focused view for reviewing and tuning live InfluxDB settings.
Tune runtime parameters from a dedicated configuration workspace
Runtime tuning stays separate from lifecycle and scaling so users can review editable InfluxDB parameters and prepare configuration changes with less ambiguity.
- Review editable `config.toml` parameters from a dedicated tuning page.
- Use Add Parameter, Export Template, Apply Template, and Save controls from the same InfluxDB configuration workspace.
- Keep parameter tuning distinct from compute, storage, and network-access changes.
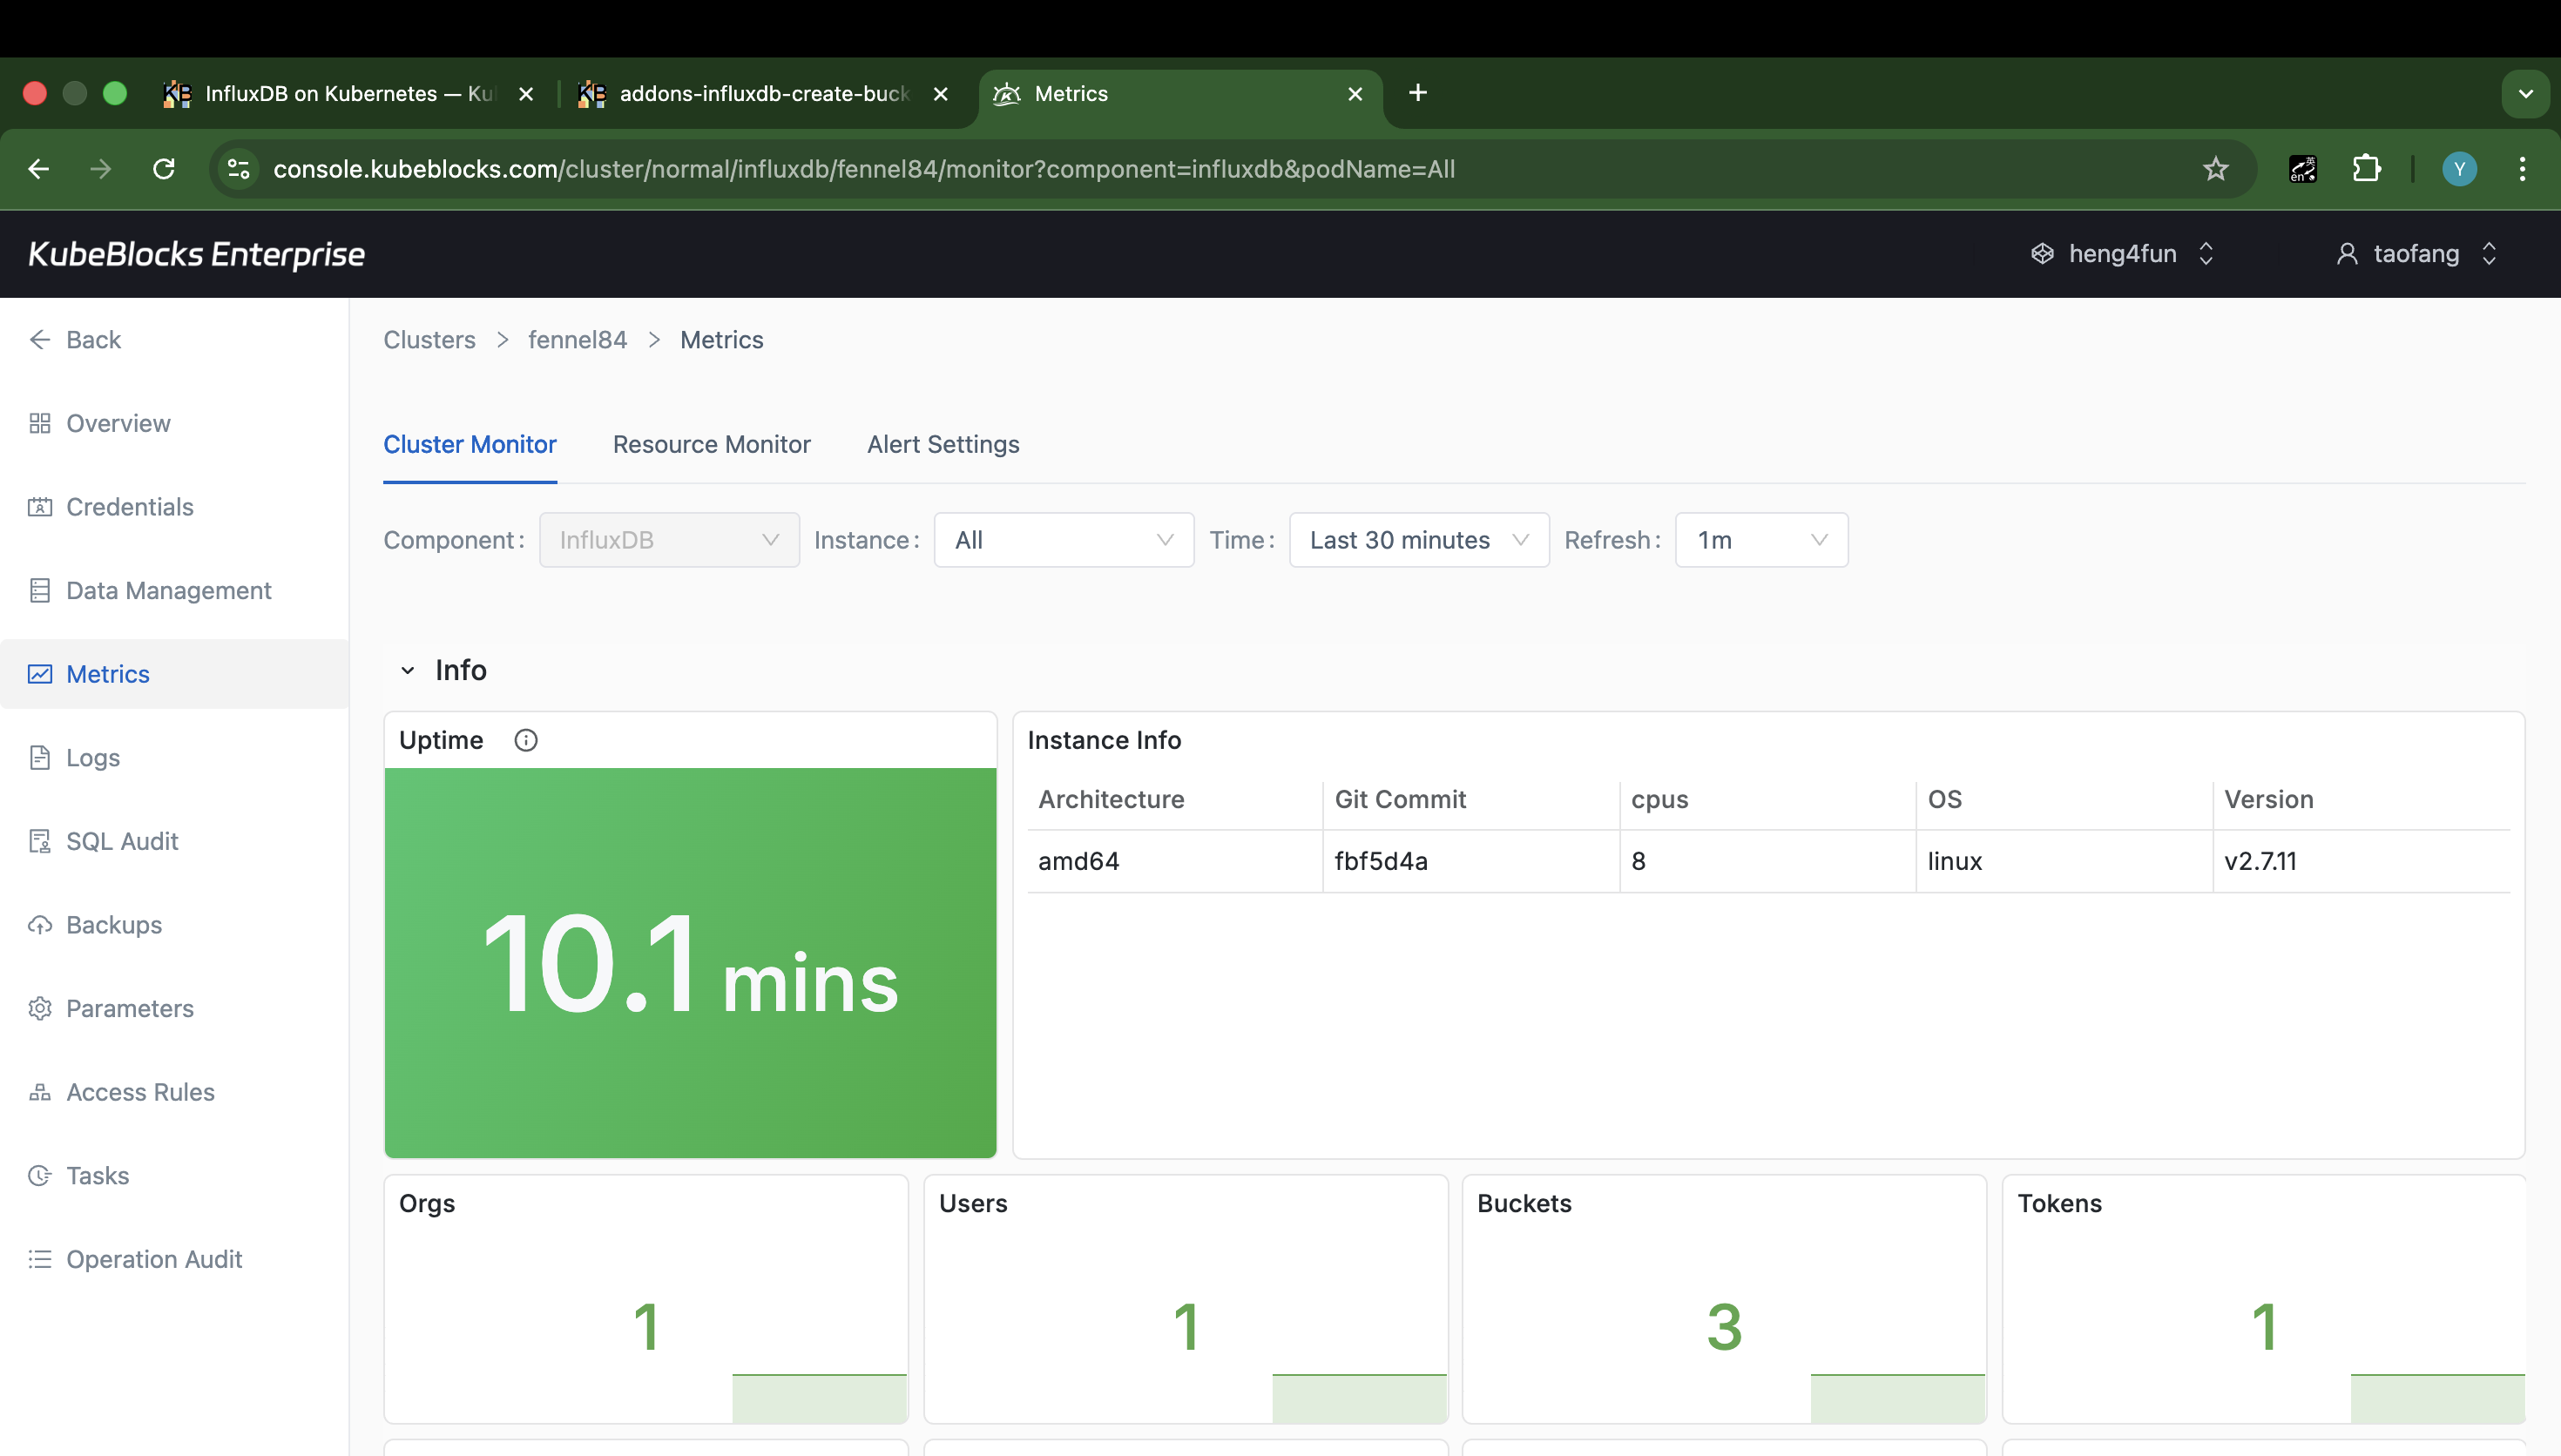
Cluster Monitor gives teams a live view into InfluxDB health and service behavior after the dashboard loads.
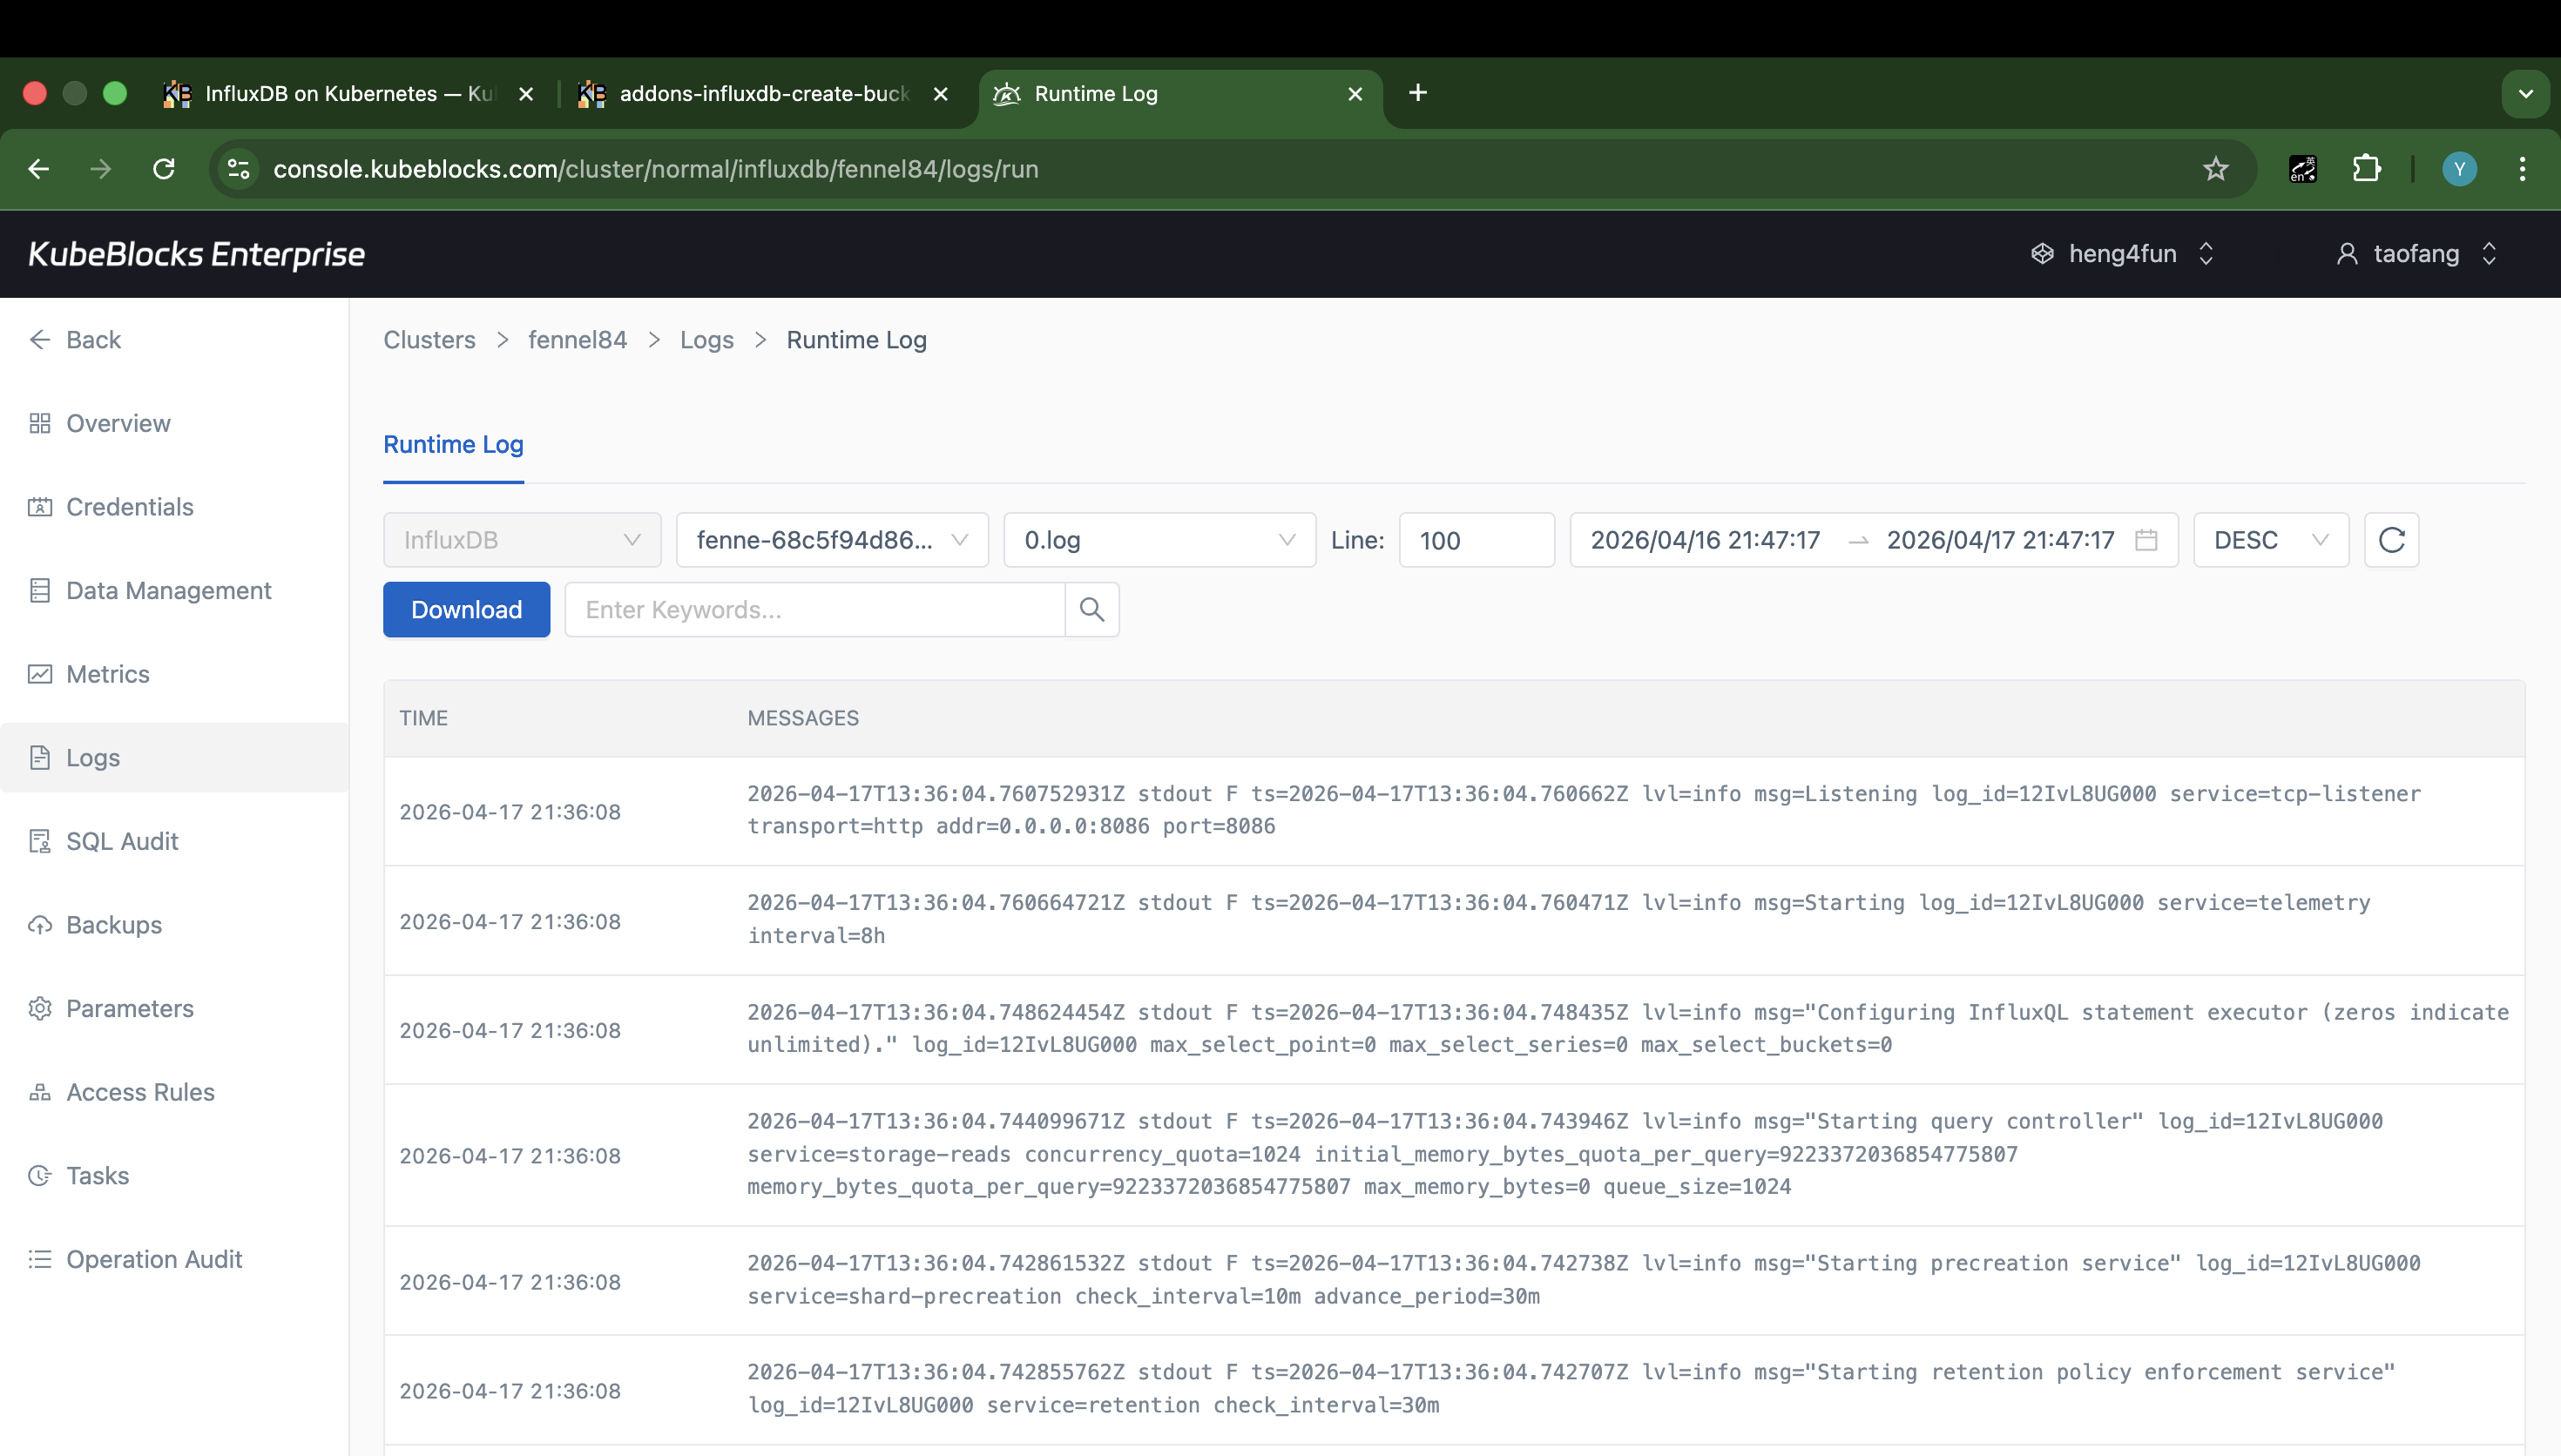
Runtime Log captures real InfluxDB service output for troubleshooting and operational validation.
Track InfluxDB health with metrics and runtime logs
Use Cluster Monitor to review current service health, then pivot into Runtime Log when users need instance-level troubleshooting evidence without leaving the cluster workspace.
- Monitor InfluxDB runtime information and dashboard cards from Cluster Monitor after it hydrates.
- Inspect real Runtime Log output when validating startup, listeners, and service behavior.
- Keep observability separate from audit and data-management workflows.
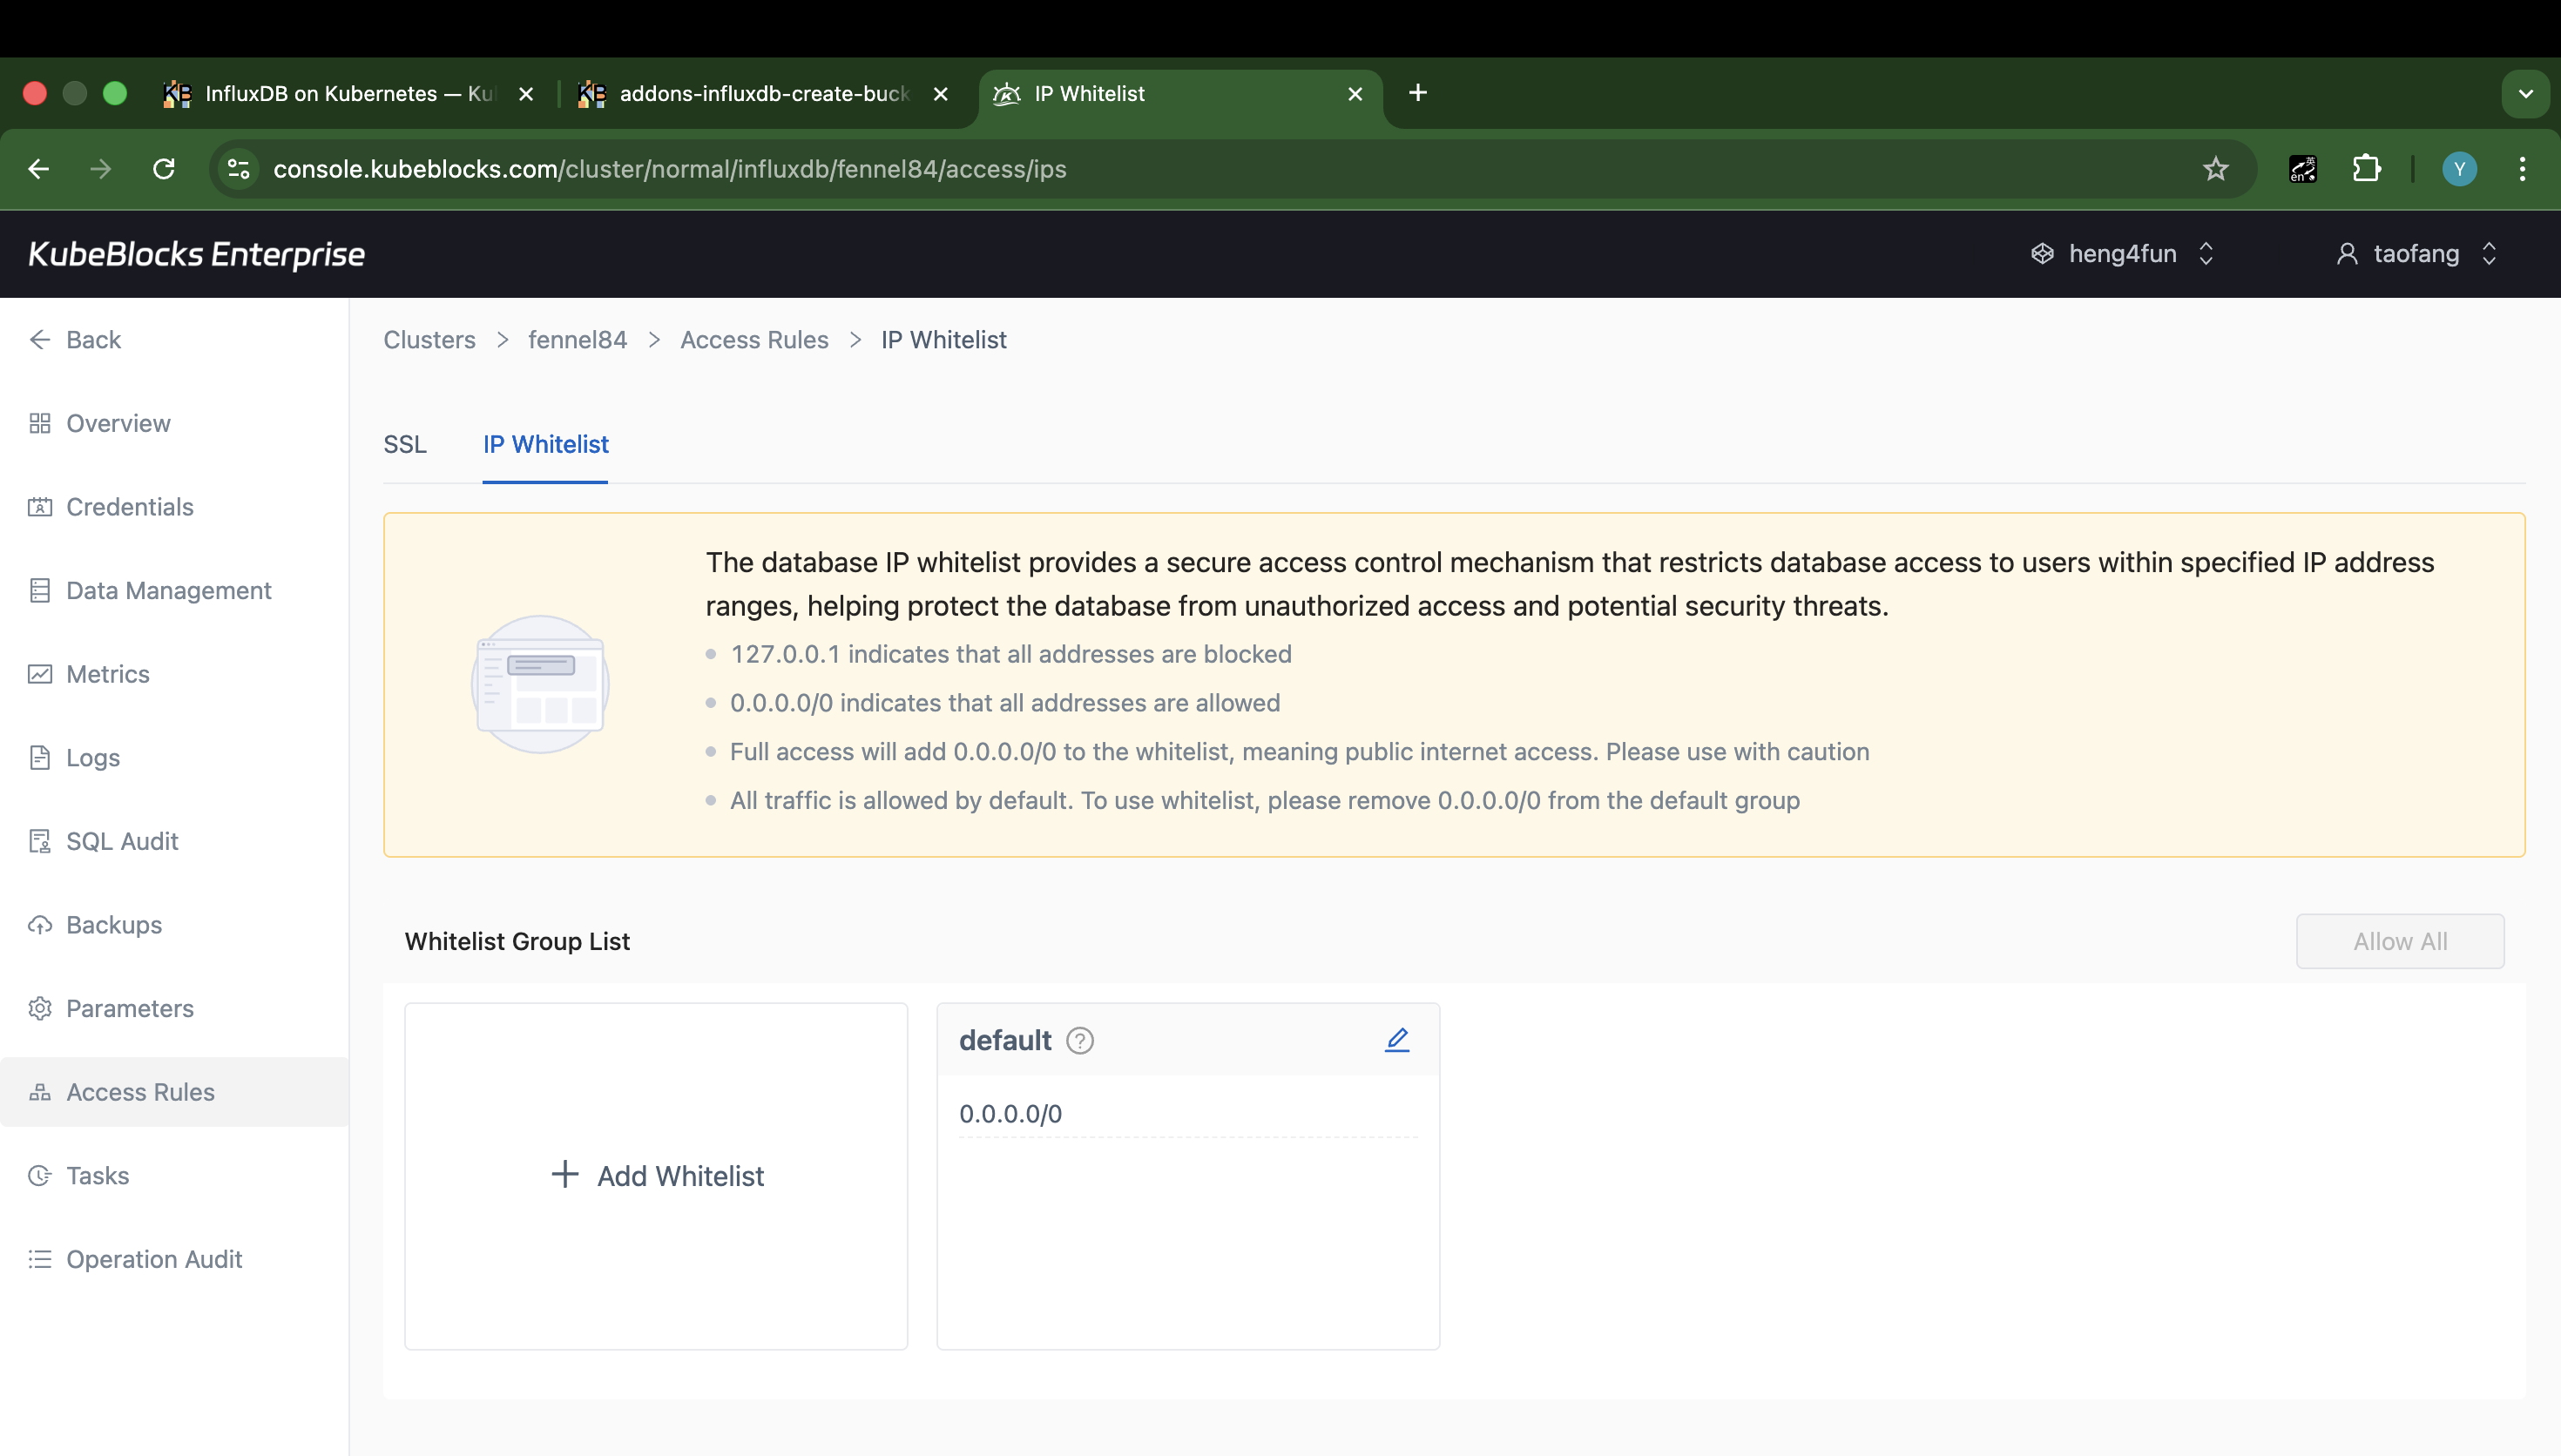
The IP Whitelist page shows the current default group and where users add or tighten source access rules.
Control InfluxDB access with IP whitelist groups
Access Rules keeps SSL and IP Whitelist controls together. The IP Whitelist page shows the default group, current CIDR entries, and the actions users use to allow or tighten source ranges.
- Open the IP Whitelist tab directly from the InfluxDB cluster workspace.
- Review the default whitelist group and the current `0.0.0.0/0` entry before narrowing source access.
- Add stricter whitelist groups from the same page when users need more controlled network access.
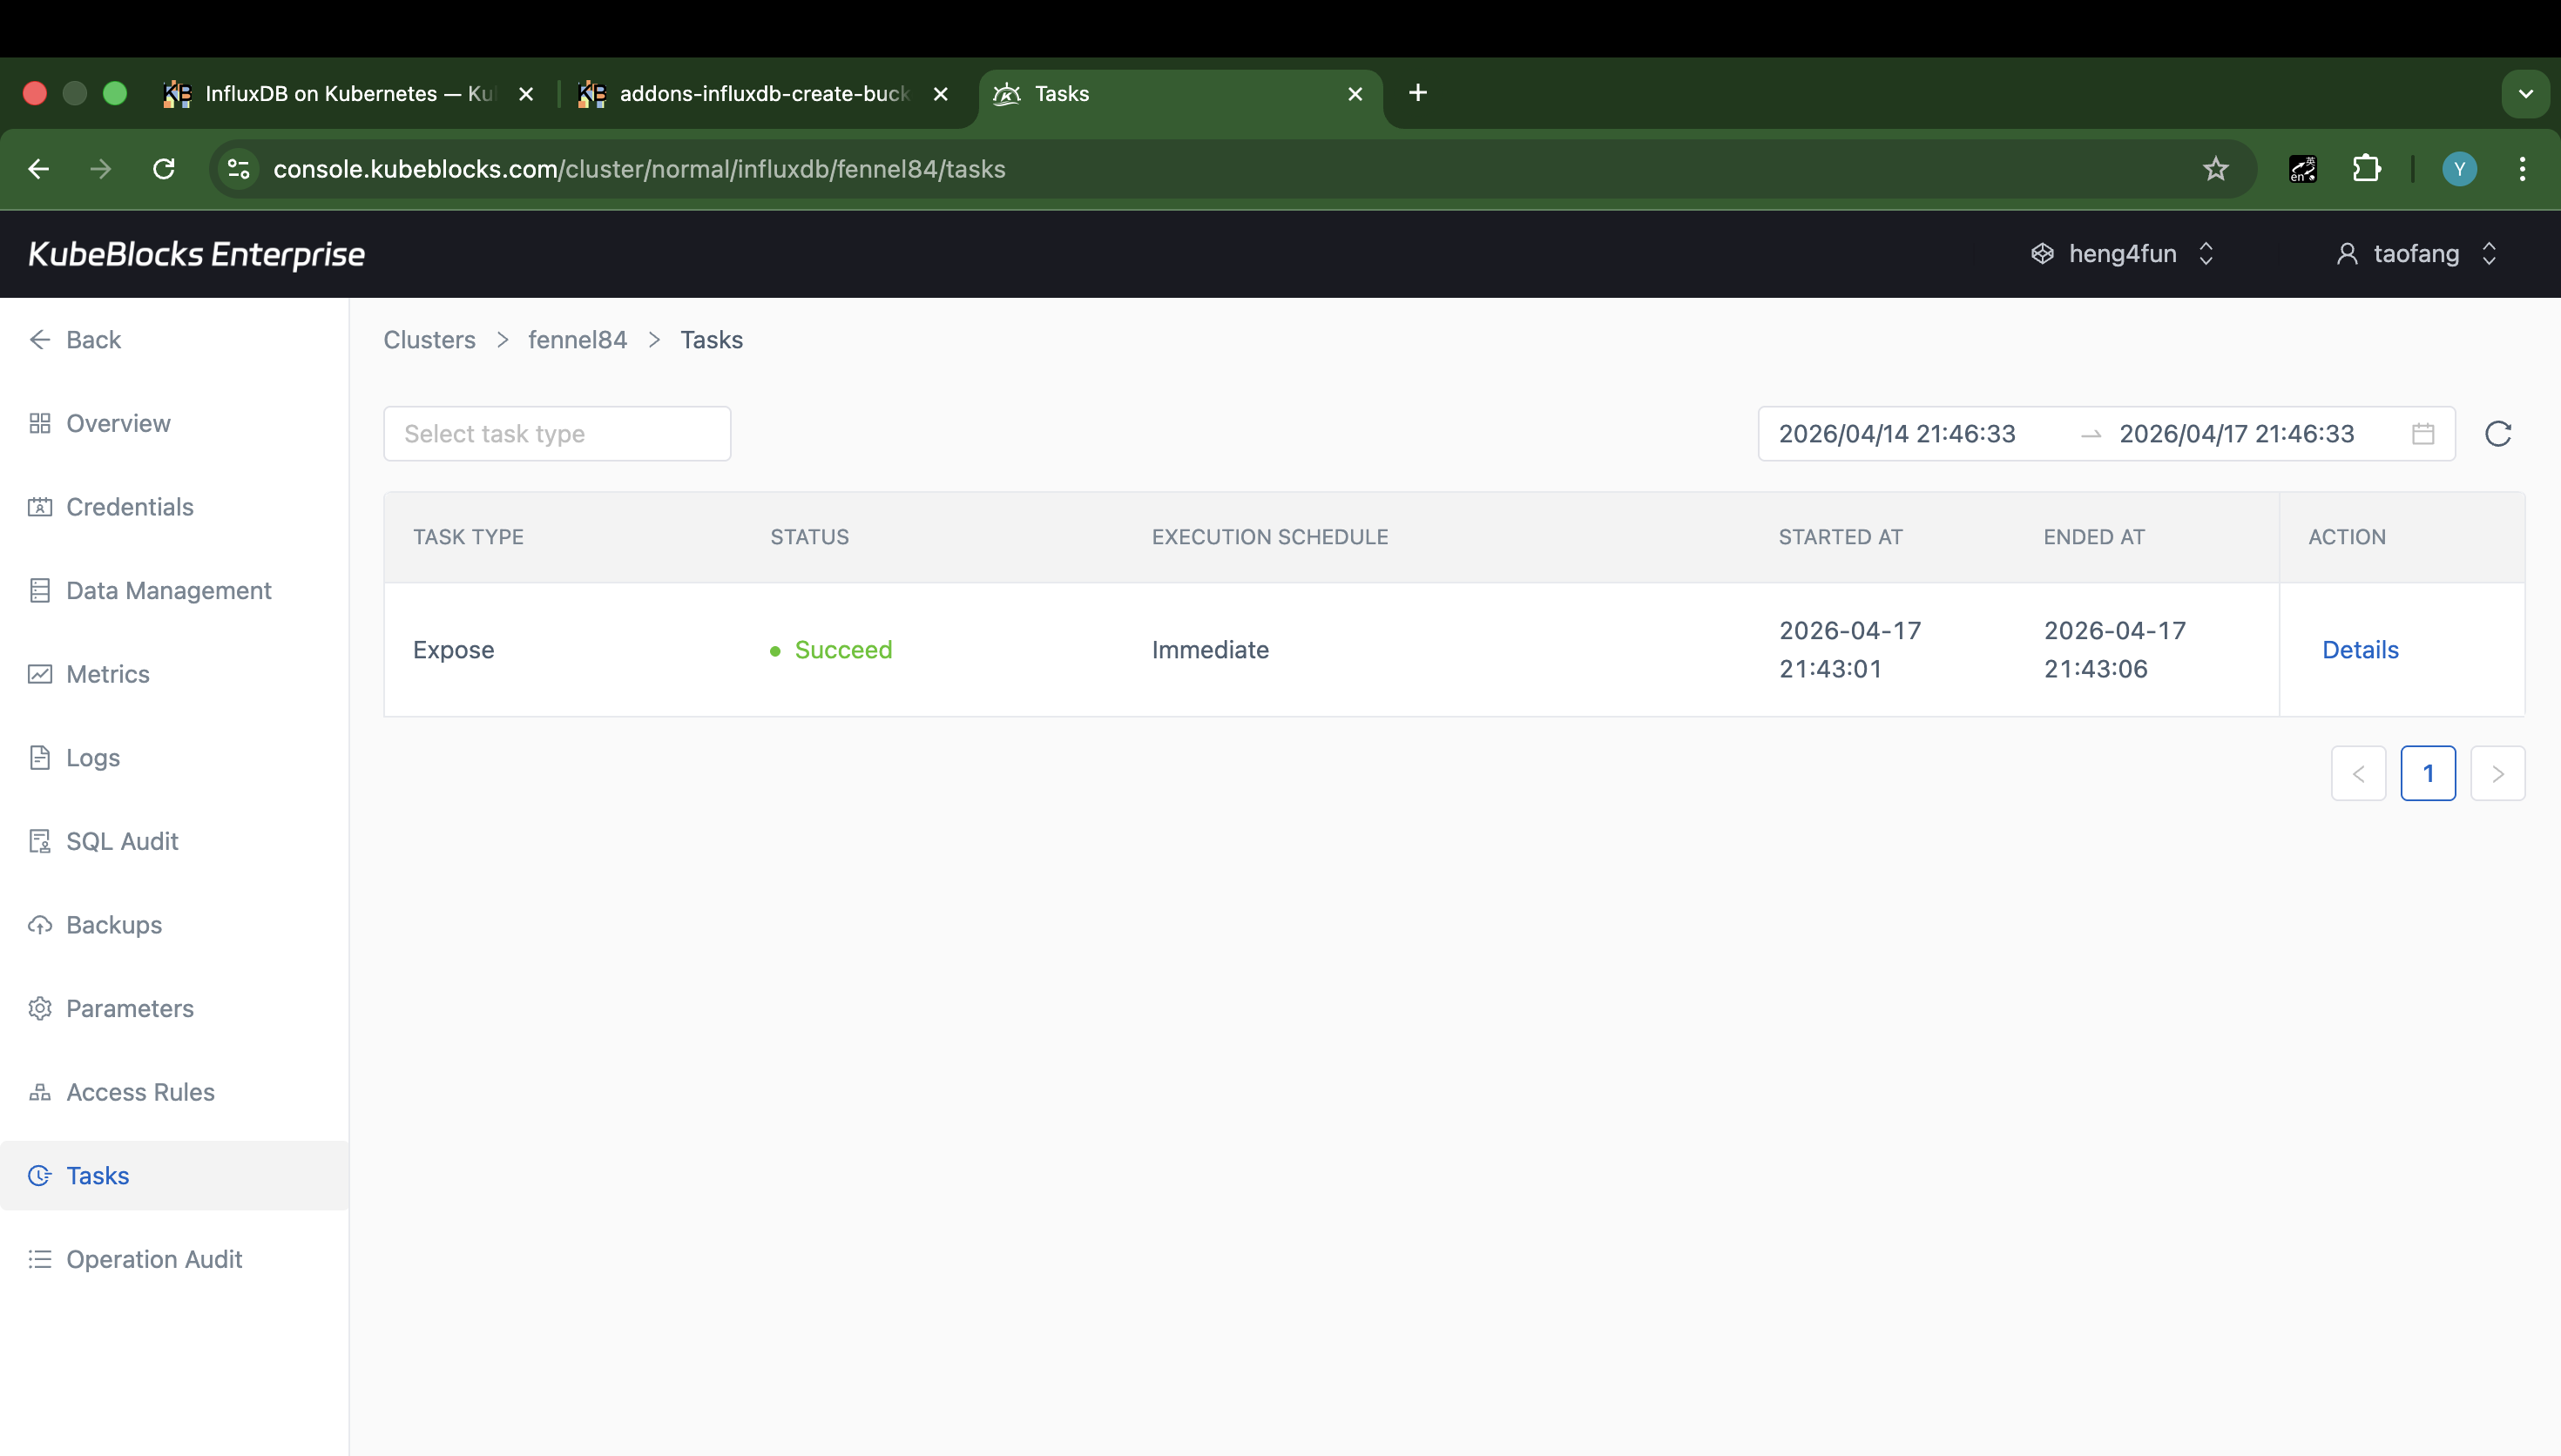
Task history gives teams a lightweight audit trail for InfluxDB operational changes such as public endpoint exposure.
Review InfluxDB operational history from task records
Task history keeps public endpoint exposure and other day-2 changes traceable, so teams can confirm what happened before handing the service back to users.
- Review task type, status, execution schedule, and timestamps from one task timeline.
- Use task records as evidence that an InfluxDB operation completed successfully.
- Keep change tracking separate from metrics, logs, and data-management workflows.
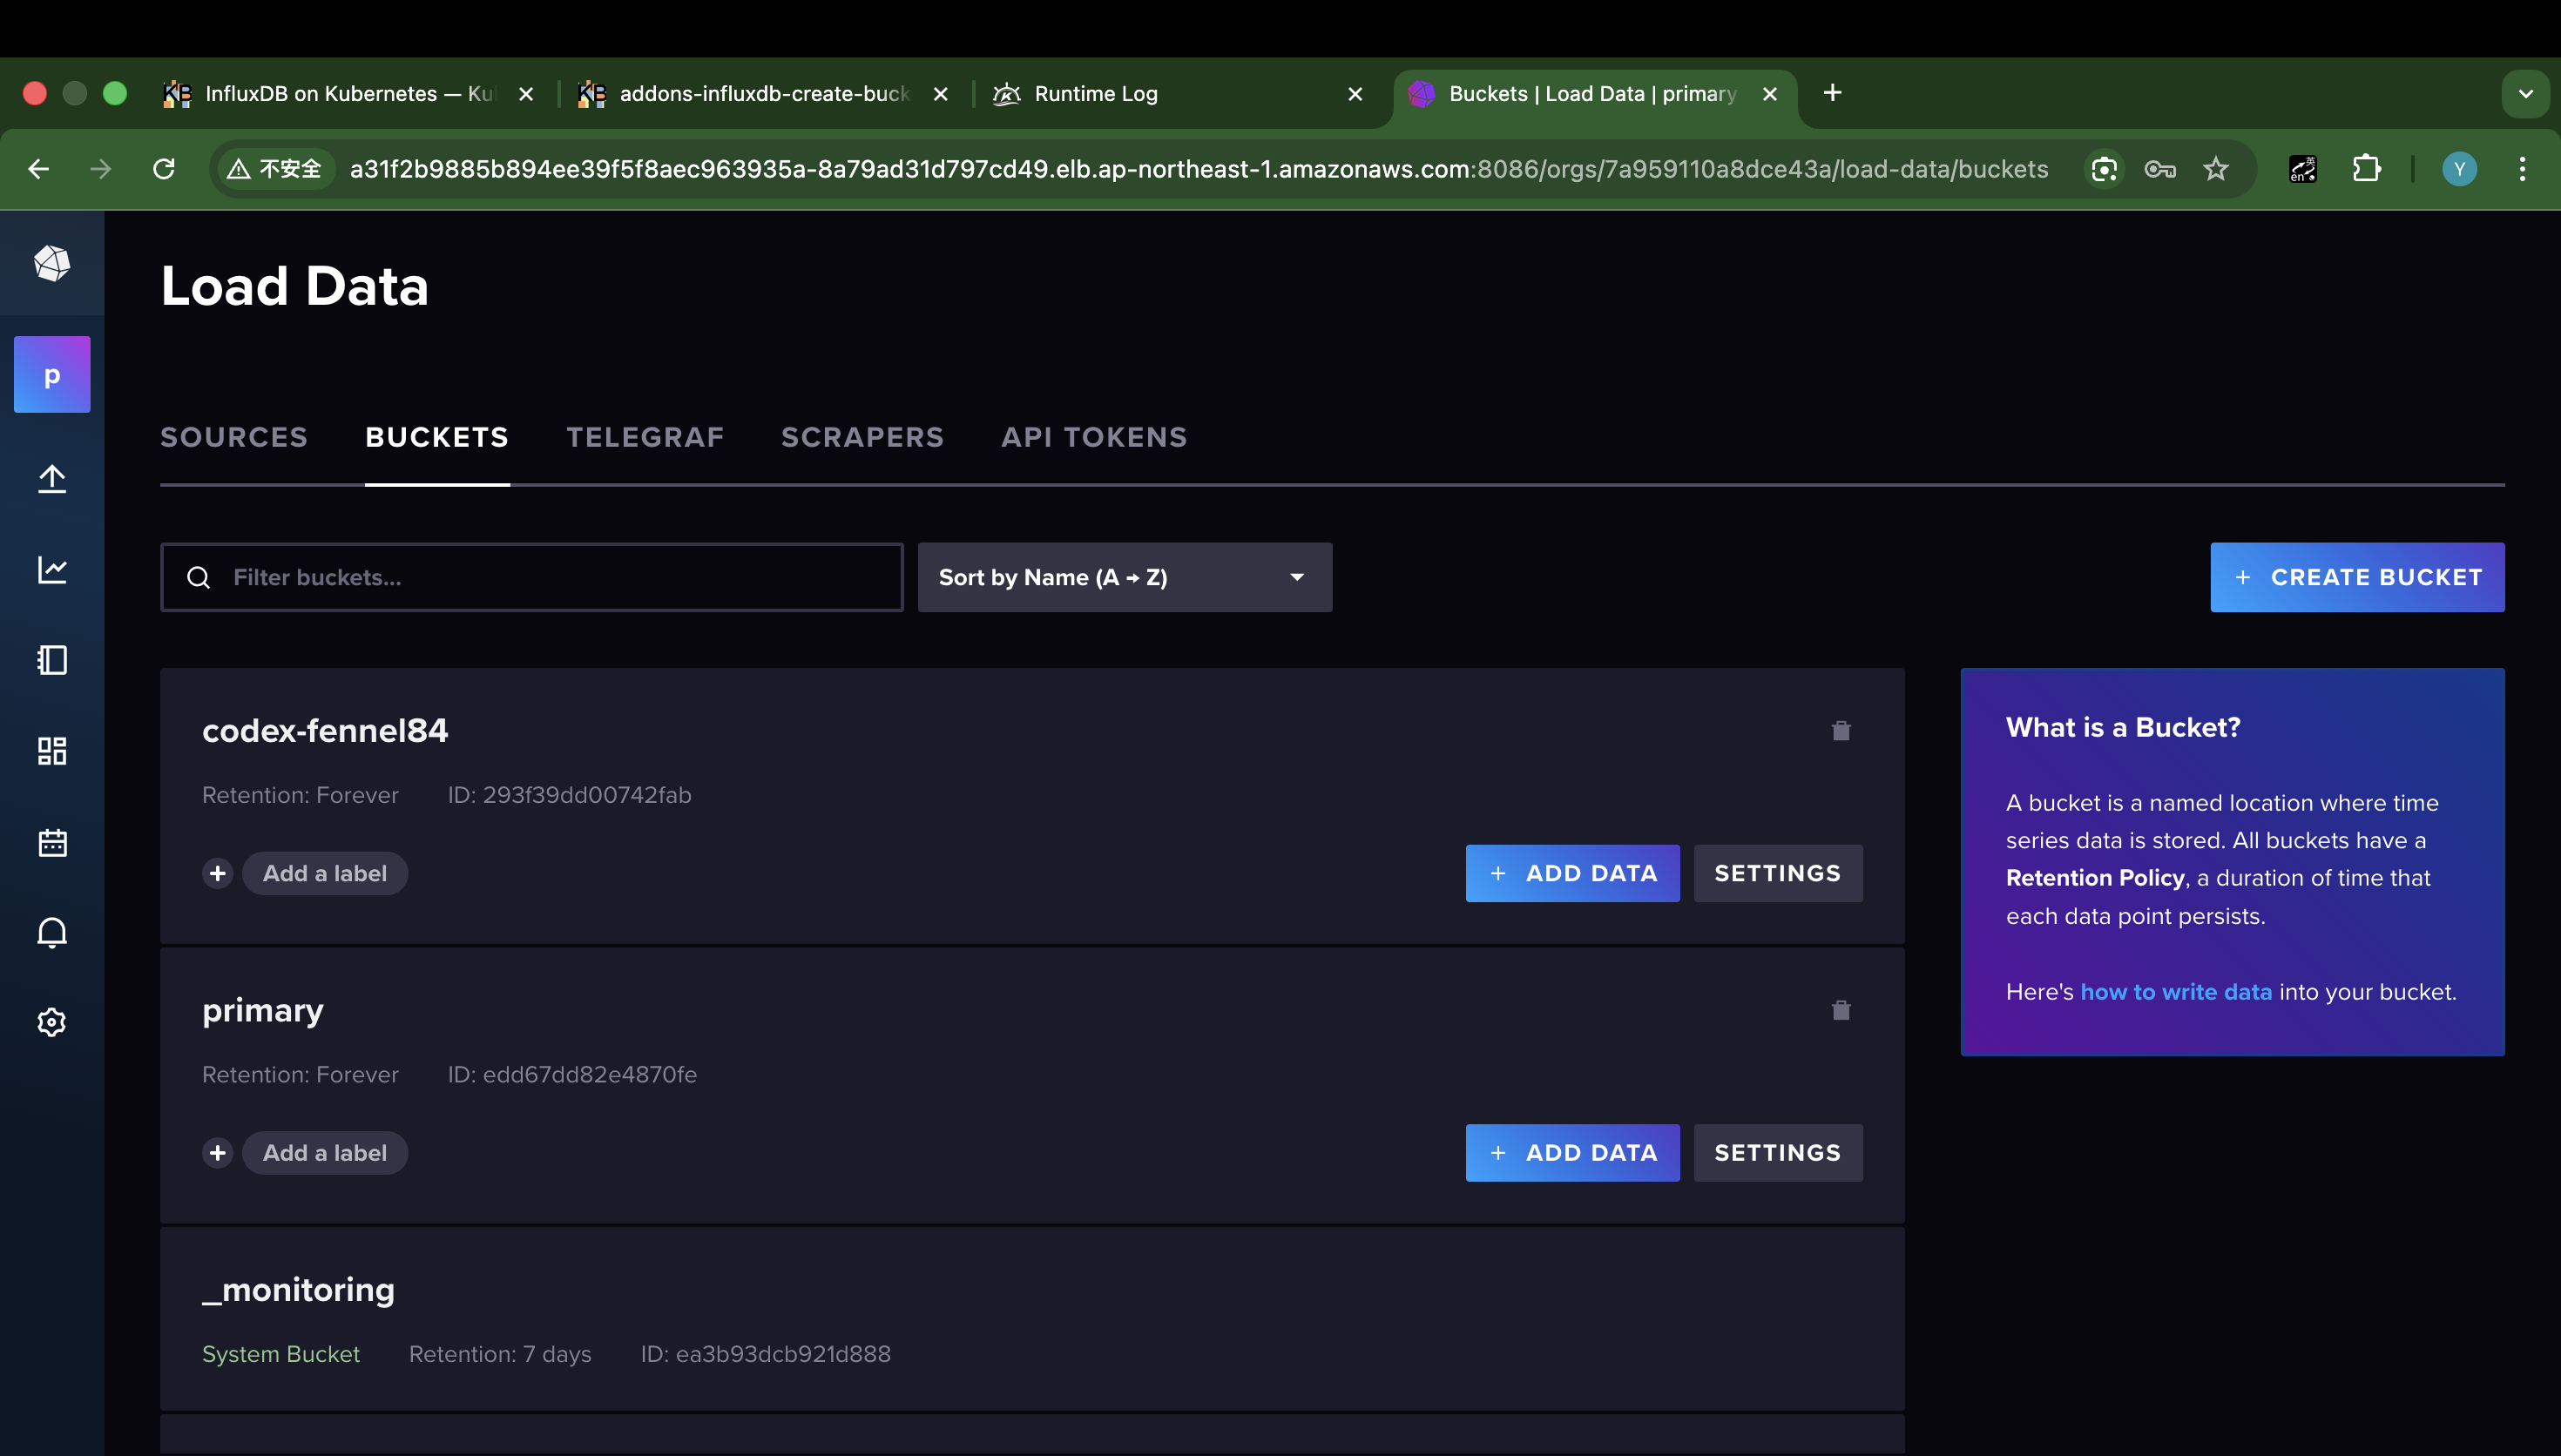
The public InfluxDB UI lets users sign in with cluster credentials and complete real bucket-management tasks from the live console.
Use the public InfluxDB UI to create and manage buckets
Enable a public LoadBalancer from Data Management, retrieve the built-in UI credentials from Credentials, sign in to the live InfluxDB UI, and complete a real bucket-management workflow instead of stopping at the endpoint handoff screen.
- Enable the public Data Management endpoint from the InfluxDB cluster workspace and wait for the LoadBalancer DNS to resolve.
- Use the `admin` UI account from Credentials to sign in to the live InfluxDB web console.
- Create a real bucket from the Buckets page so the screenshot proves InfluxDB data-management workflow coverage in the actual UI.
Ready to build your own DBaaS on Kubernetes?
Talk to our team and see how KubeBlocks Enterprise can help you consolidate databases, strengthen security, and reduce operational costs.