
KubeBlocks for
Elasticsearch
Elasticsearch is a distributed search and analytics engine built on Apache Lucene. It provides near real-time full-text search, structured search, and analytics across massive datasets — powering log analytics, APM, and enterprise search.
Supported versions
Available on
 AWS
AWS Azure
Azure GCP
GCP OCI
OCI Alibaba Cloud
 Rancher
 OpenShift
Databases
 MySQL
MySQL PostgreSQLOracle
 SQL Server
 Redis
Redis MongoDB
 ClickHouse
Vector & AI
 Qdrant
 Milvus
 Elasticsearch
Message queues
 RocketMQ
 RabbitMQ
 Kafka
KafkaOthers
 VictoriaMetrics
 InfluxDB
 etcd
etcd ZooKeeper
Extend database engines like plug-ins
KubeBlocks provides unified database operations through its addon-based architecture. With KubeBlocks Enterprise, access over 15 seamless integrations to scale your database services.
One control plane, consistent operations across all engines — powered by the addon mechanism.
Run Elasticsearch with guided lifecycle, scaling, access, and data workflows
Operate Elasticsearch with a rich create wizard, replica, compute, and storage scaling, backups, metrics, logs, IP whitelist controls, task history, and a public Kibana data-management workflow backed by real KubeBlocks Enterprise evidence.
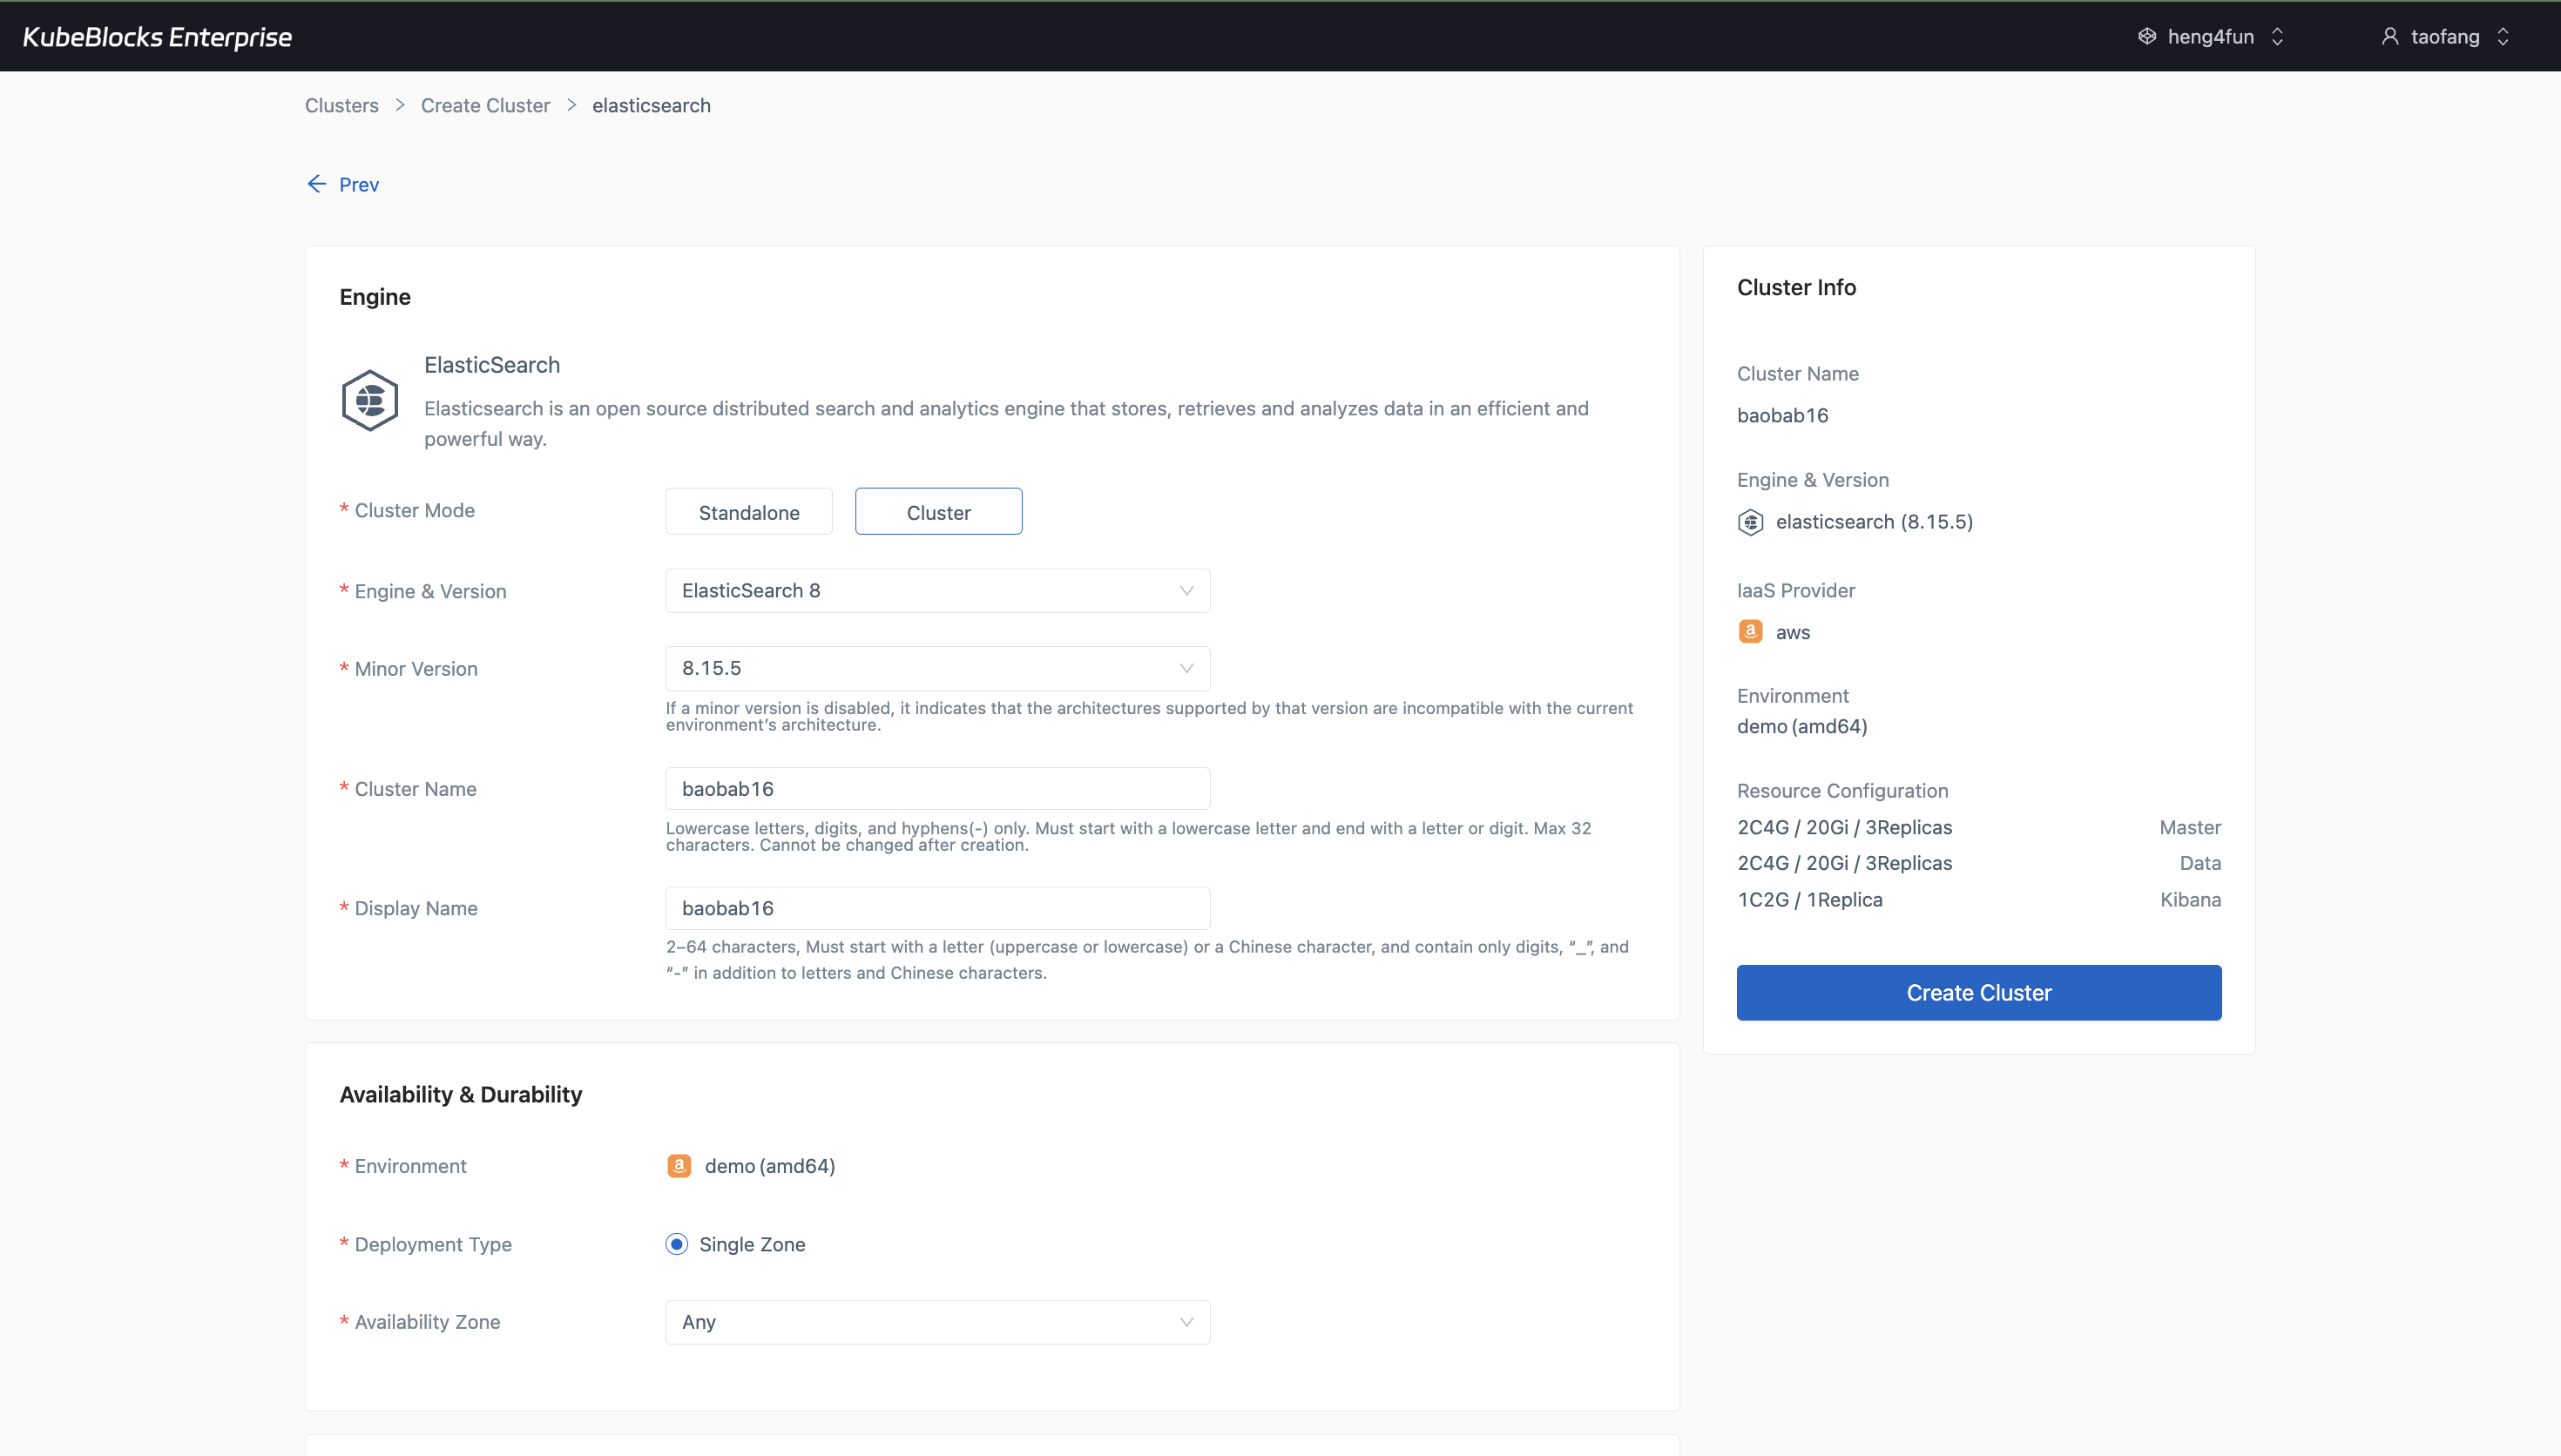
The create wizard makes Elasticsearch topology, version, compute, storage, TLS, backup, and project choices visible before provisioning.
Create Elasticsearch clusters with topology and service choices visible
Launch Elasticsearch from a guided wizard that keeps cluster mode, engine version, environment, master and data sizing, Kibana, TLS, backup policy, maintenance window, and project placement visible before provisioning begins.
- Choose Standalone or Cluster mode, ElasticSearch 8, and the target minor version before users create the cluster.
- Review master, data, and Kibana configuration alongside storage class, storage size, replicas, TLS, and backup settings.
- Confirm the generated cluster summary before the deployment moves into the day-2 operations workspace.
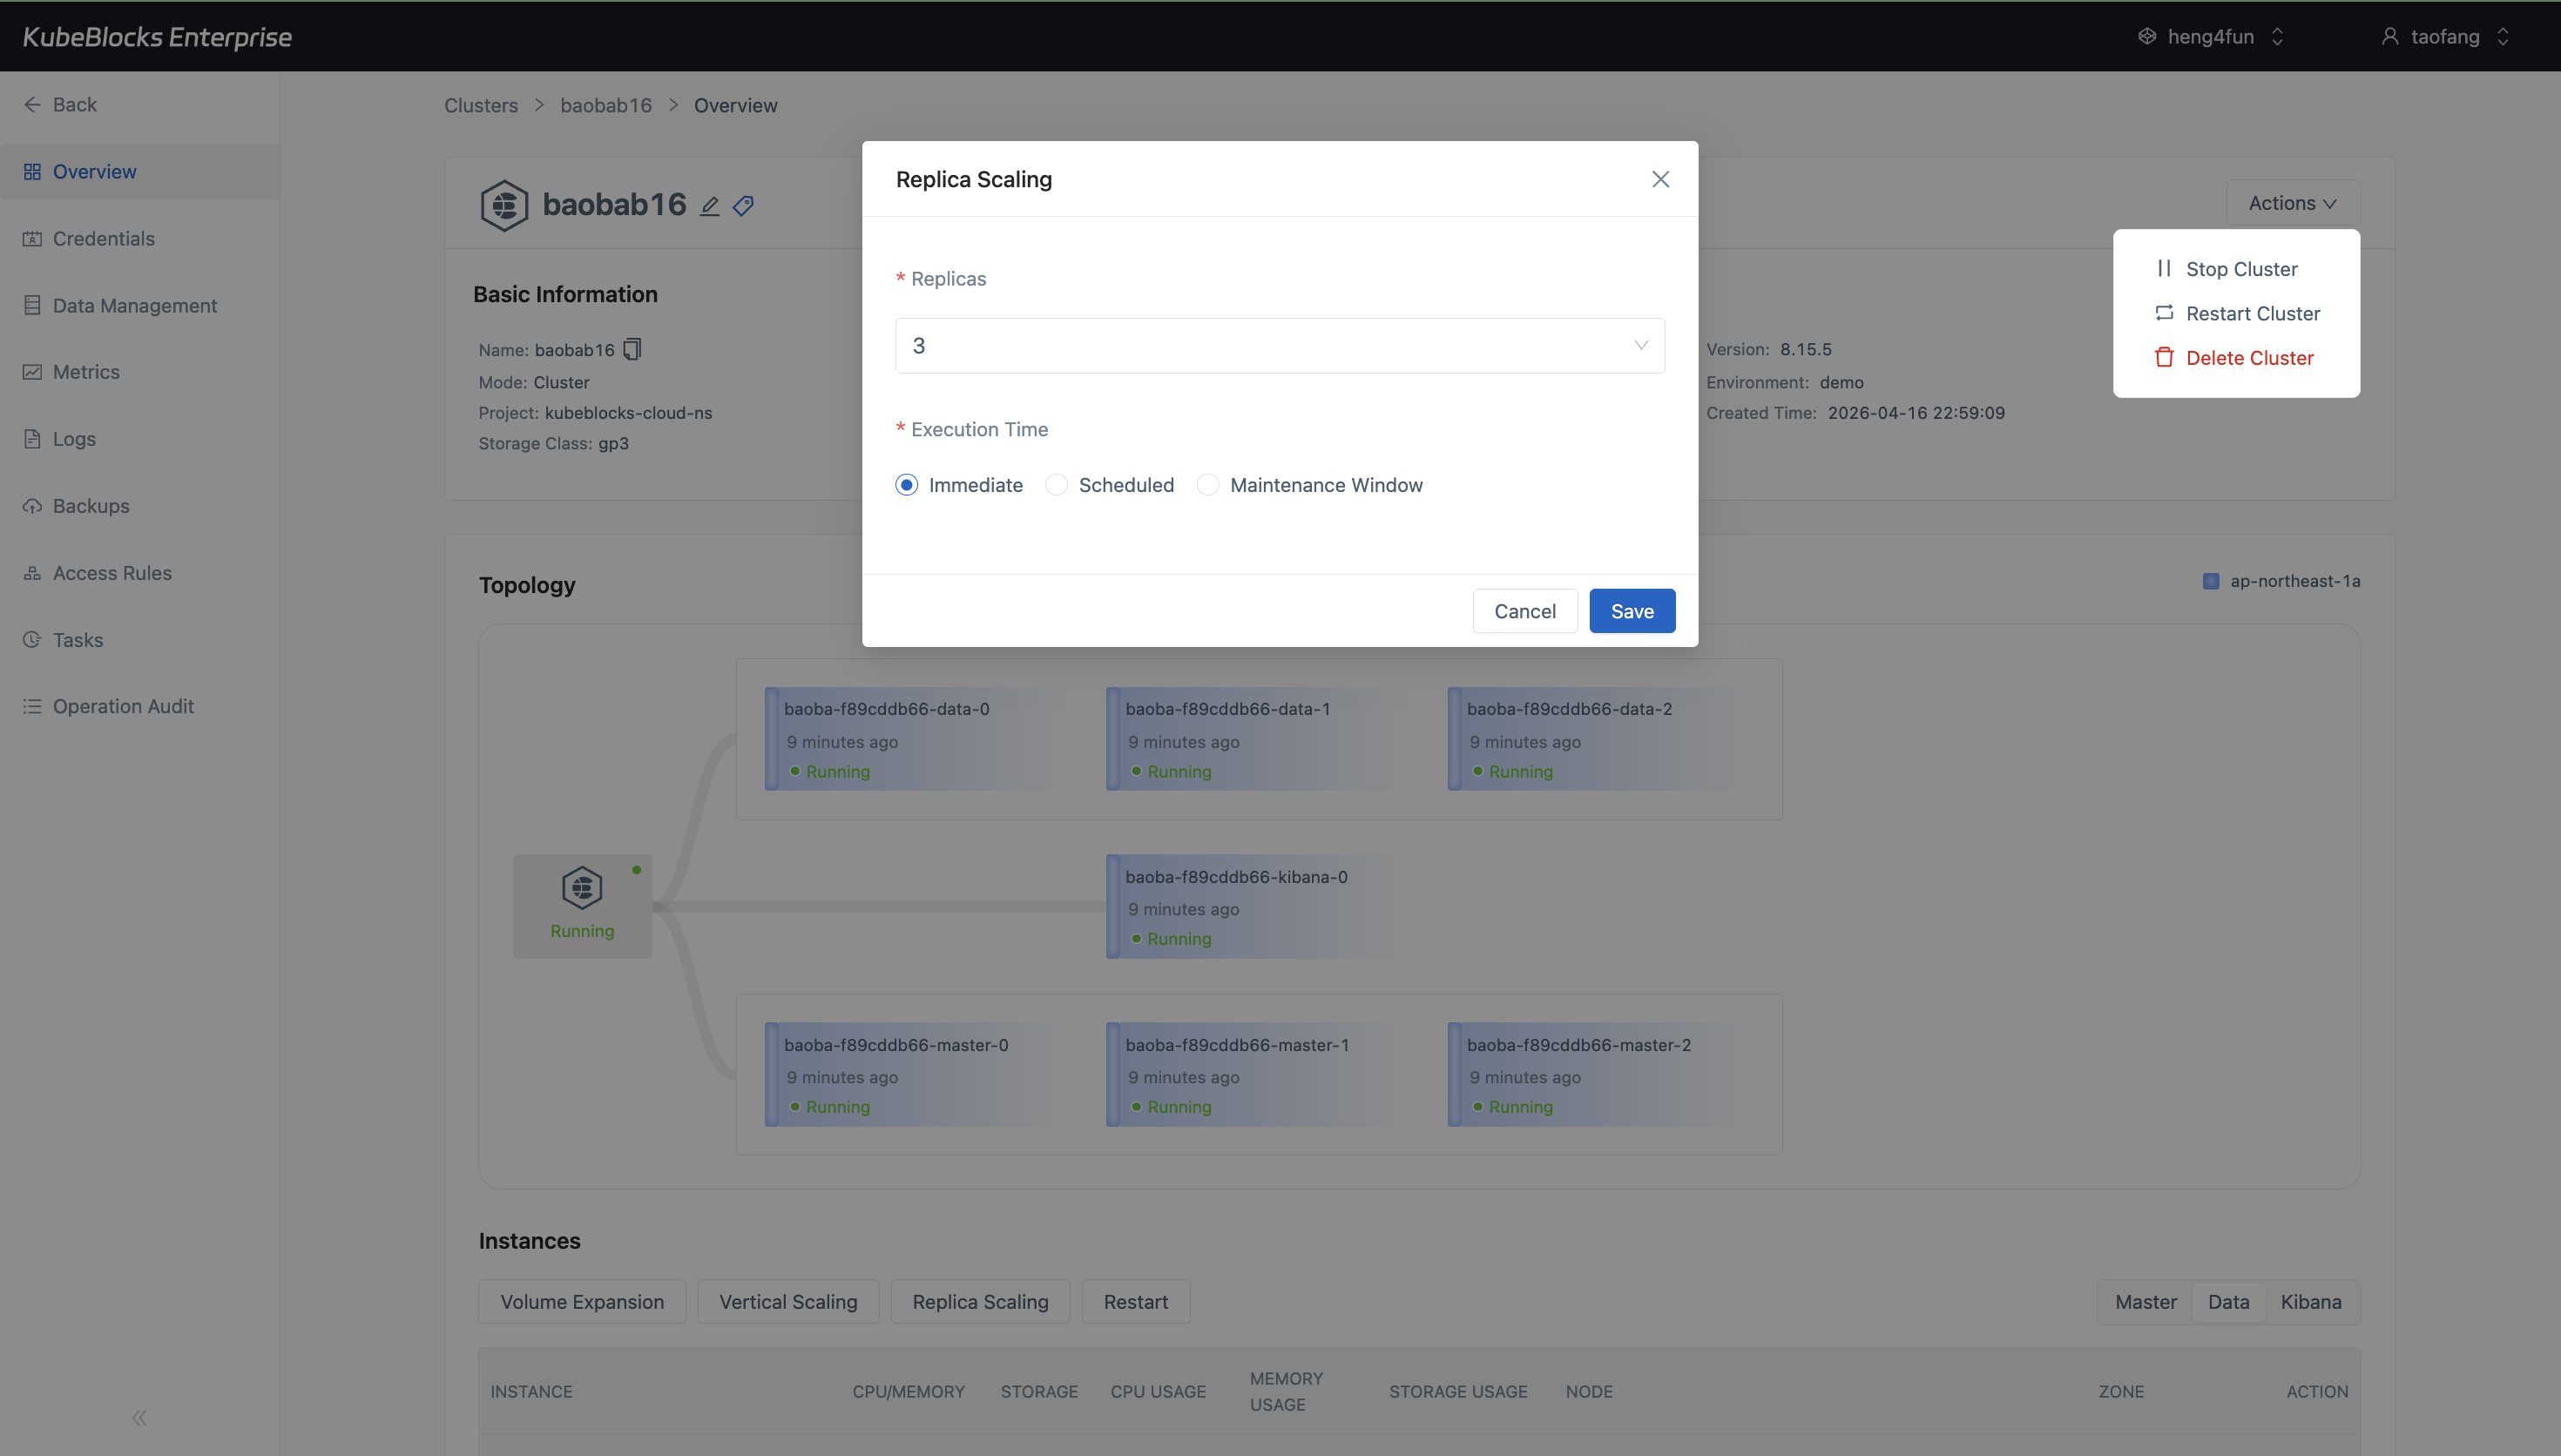
Horizontal Scaling shows the running data replicas, current replica count, and execution timing before users save a topology change.
Adjust Elasticsearch data-node replicas before topology changes
Horizontal Scaling gives users a focused place to review the Data component's current replica count and execution timing before changing the number of Elasticsearch data nodes.
- Open Horizontal Scaling from the Data component instead of relying on a generic topology page.
- Review the current replica count before adding or removing Elasticsearch data-node capacity.
- Choose Immediate, Scheduled, or Maintenance Window execution timing before saving the topology change.
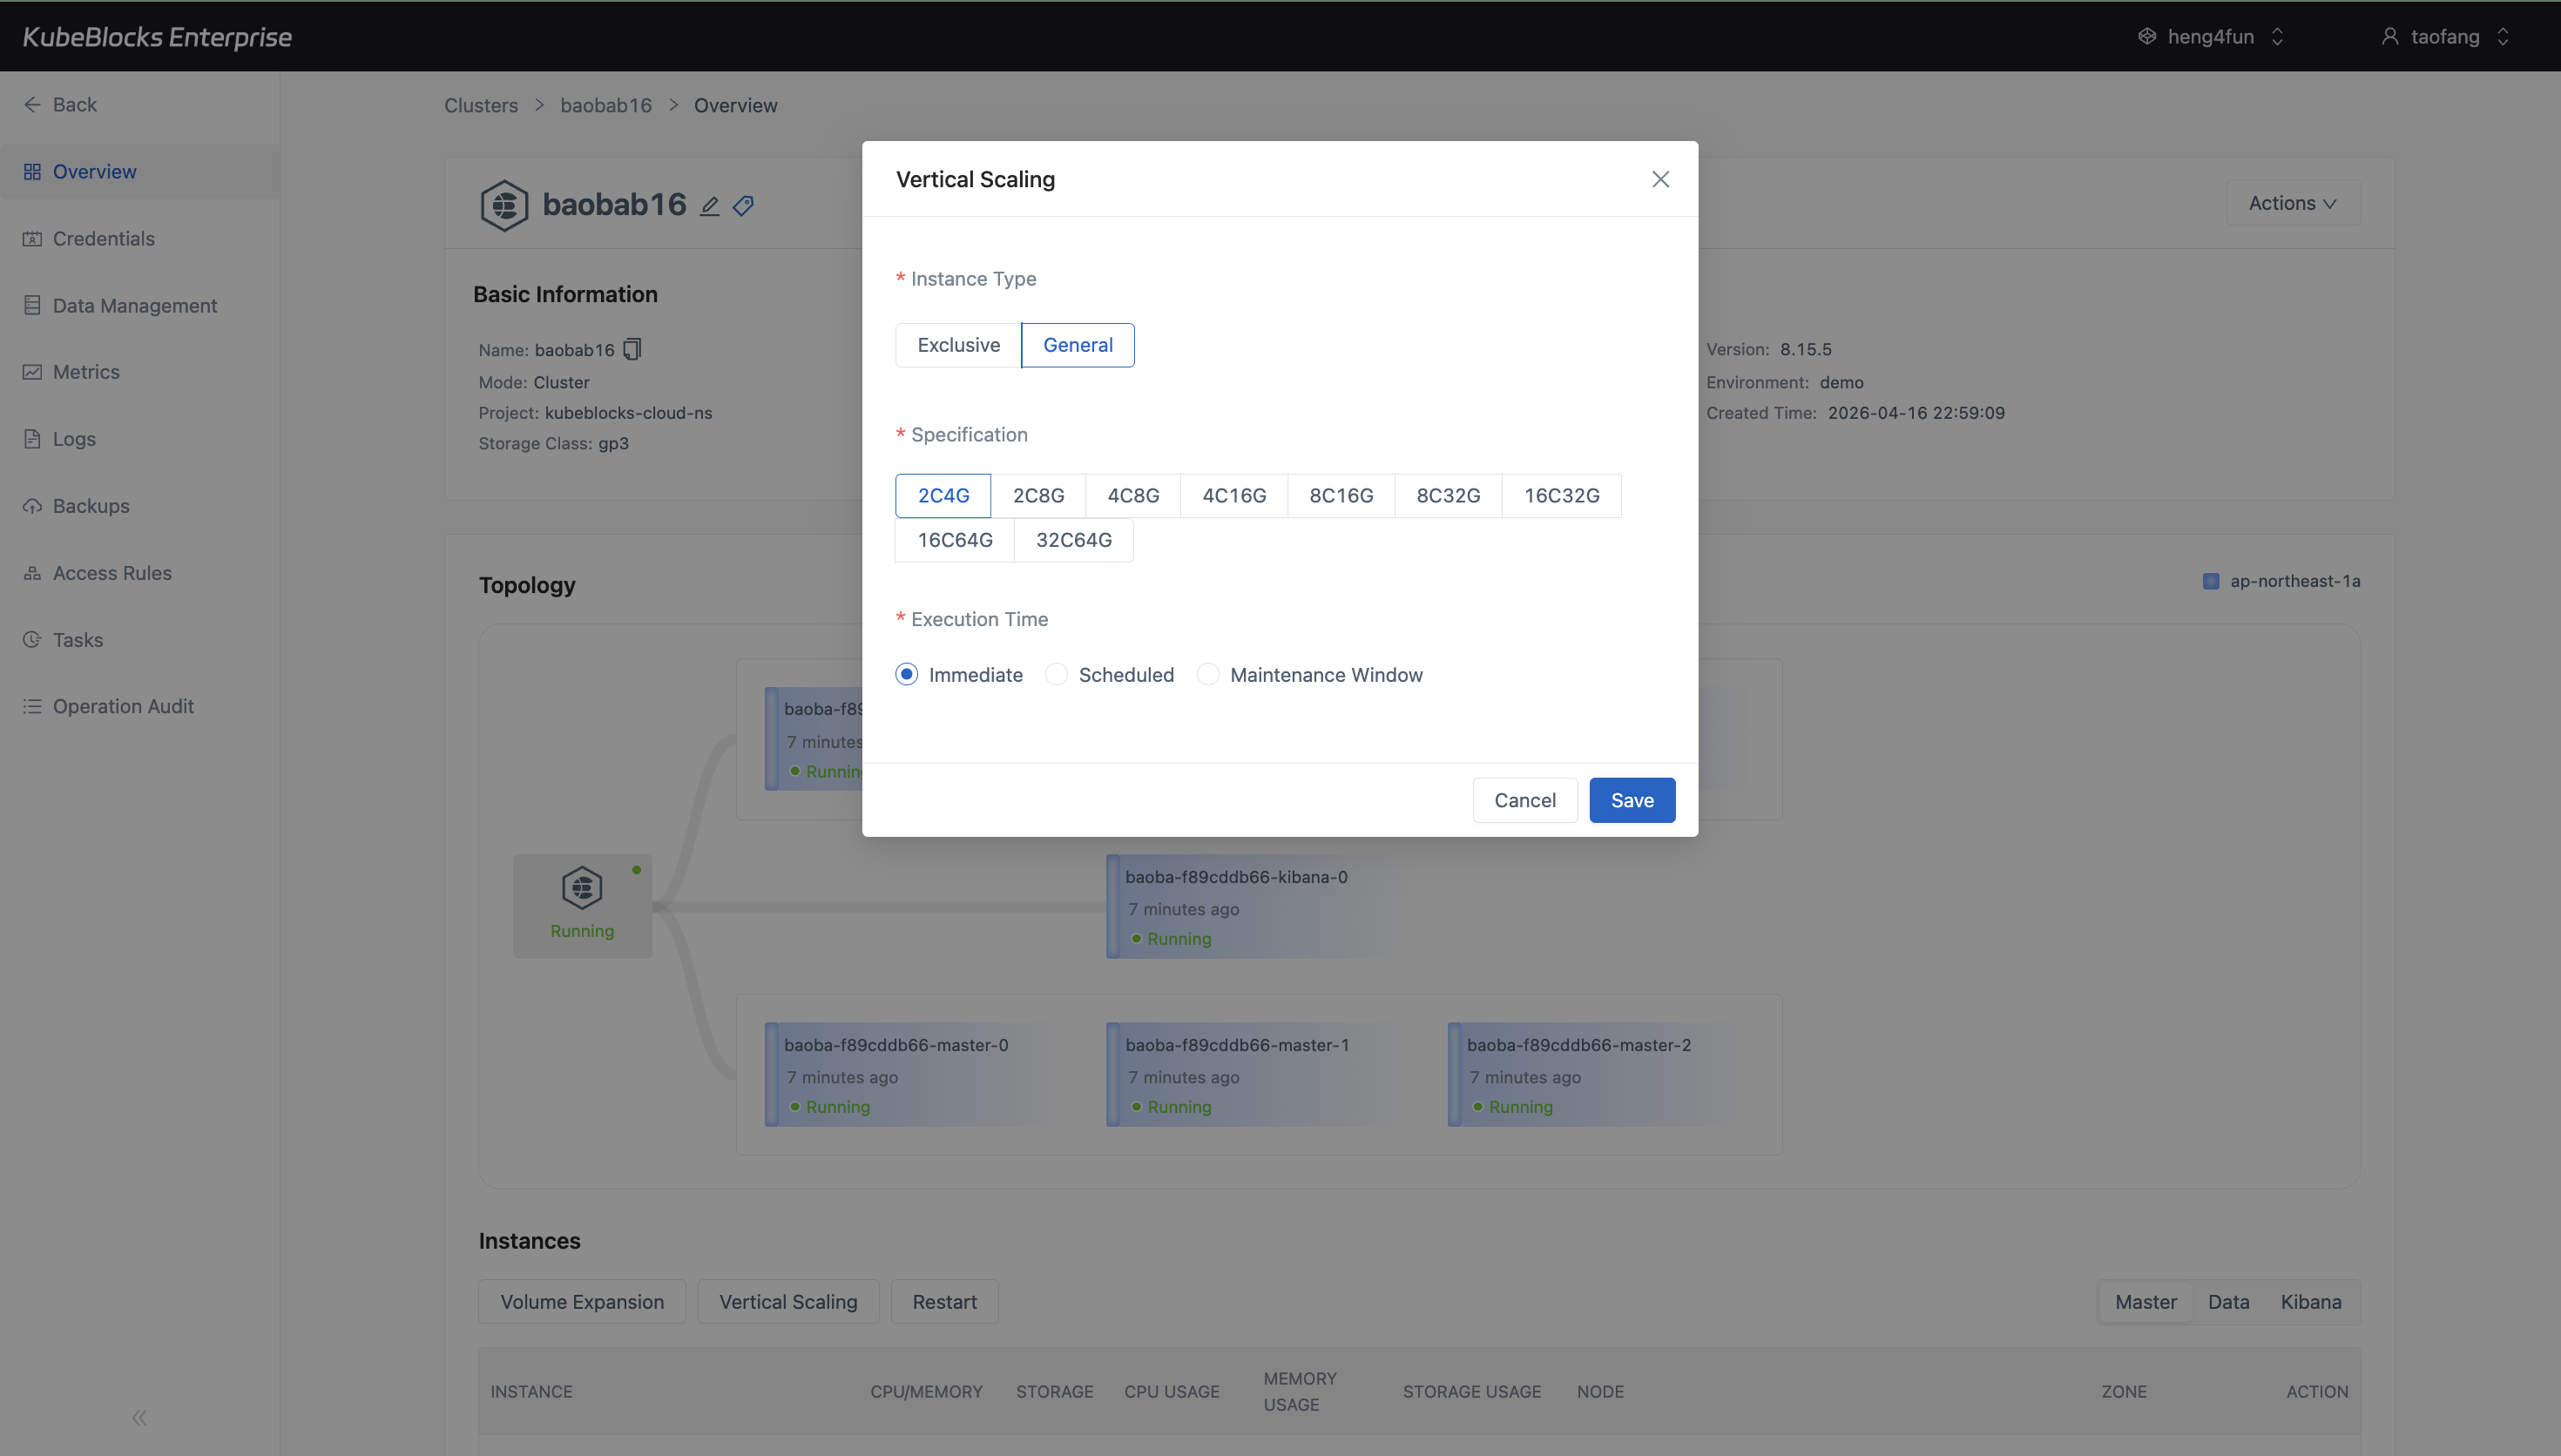
Vertical Scaling shows Elasticsearch CPU and memory choices plus execution timing before users save a compute change.
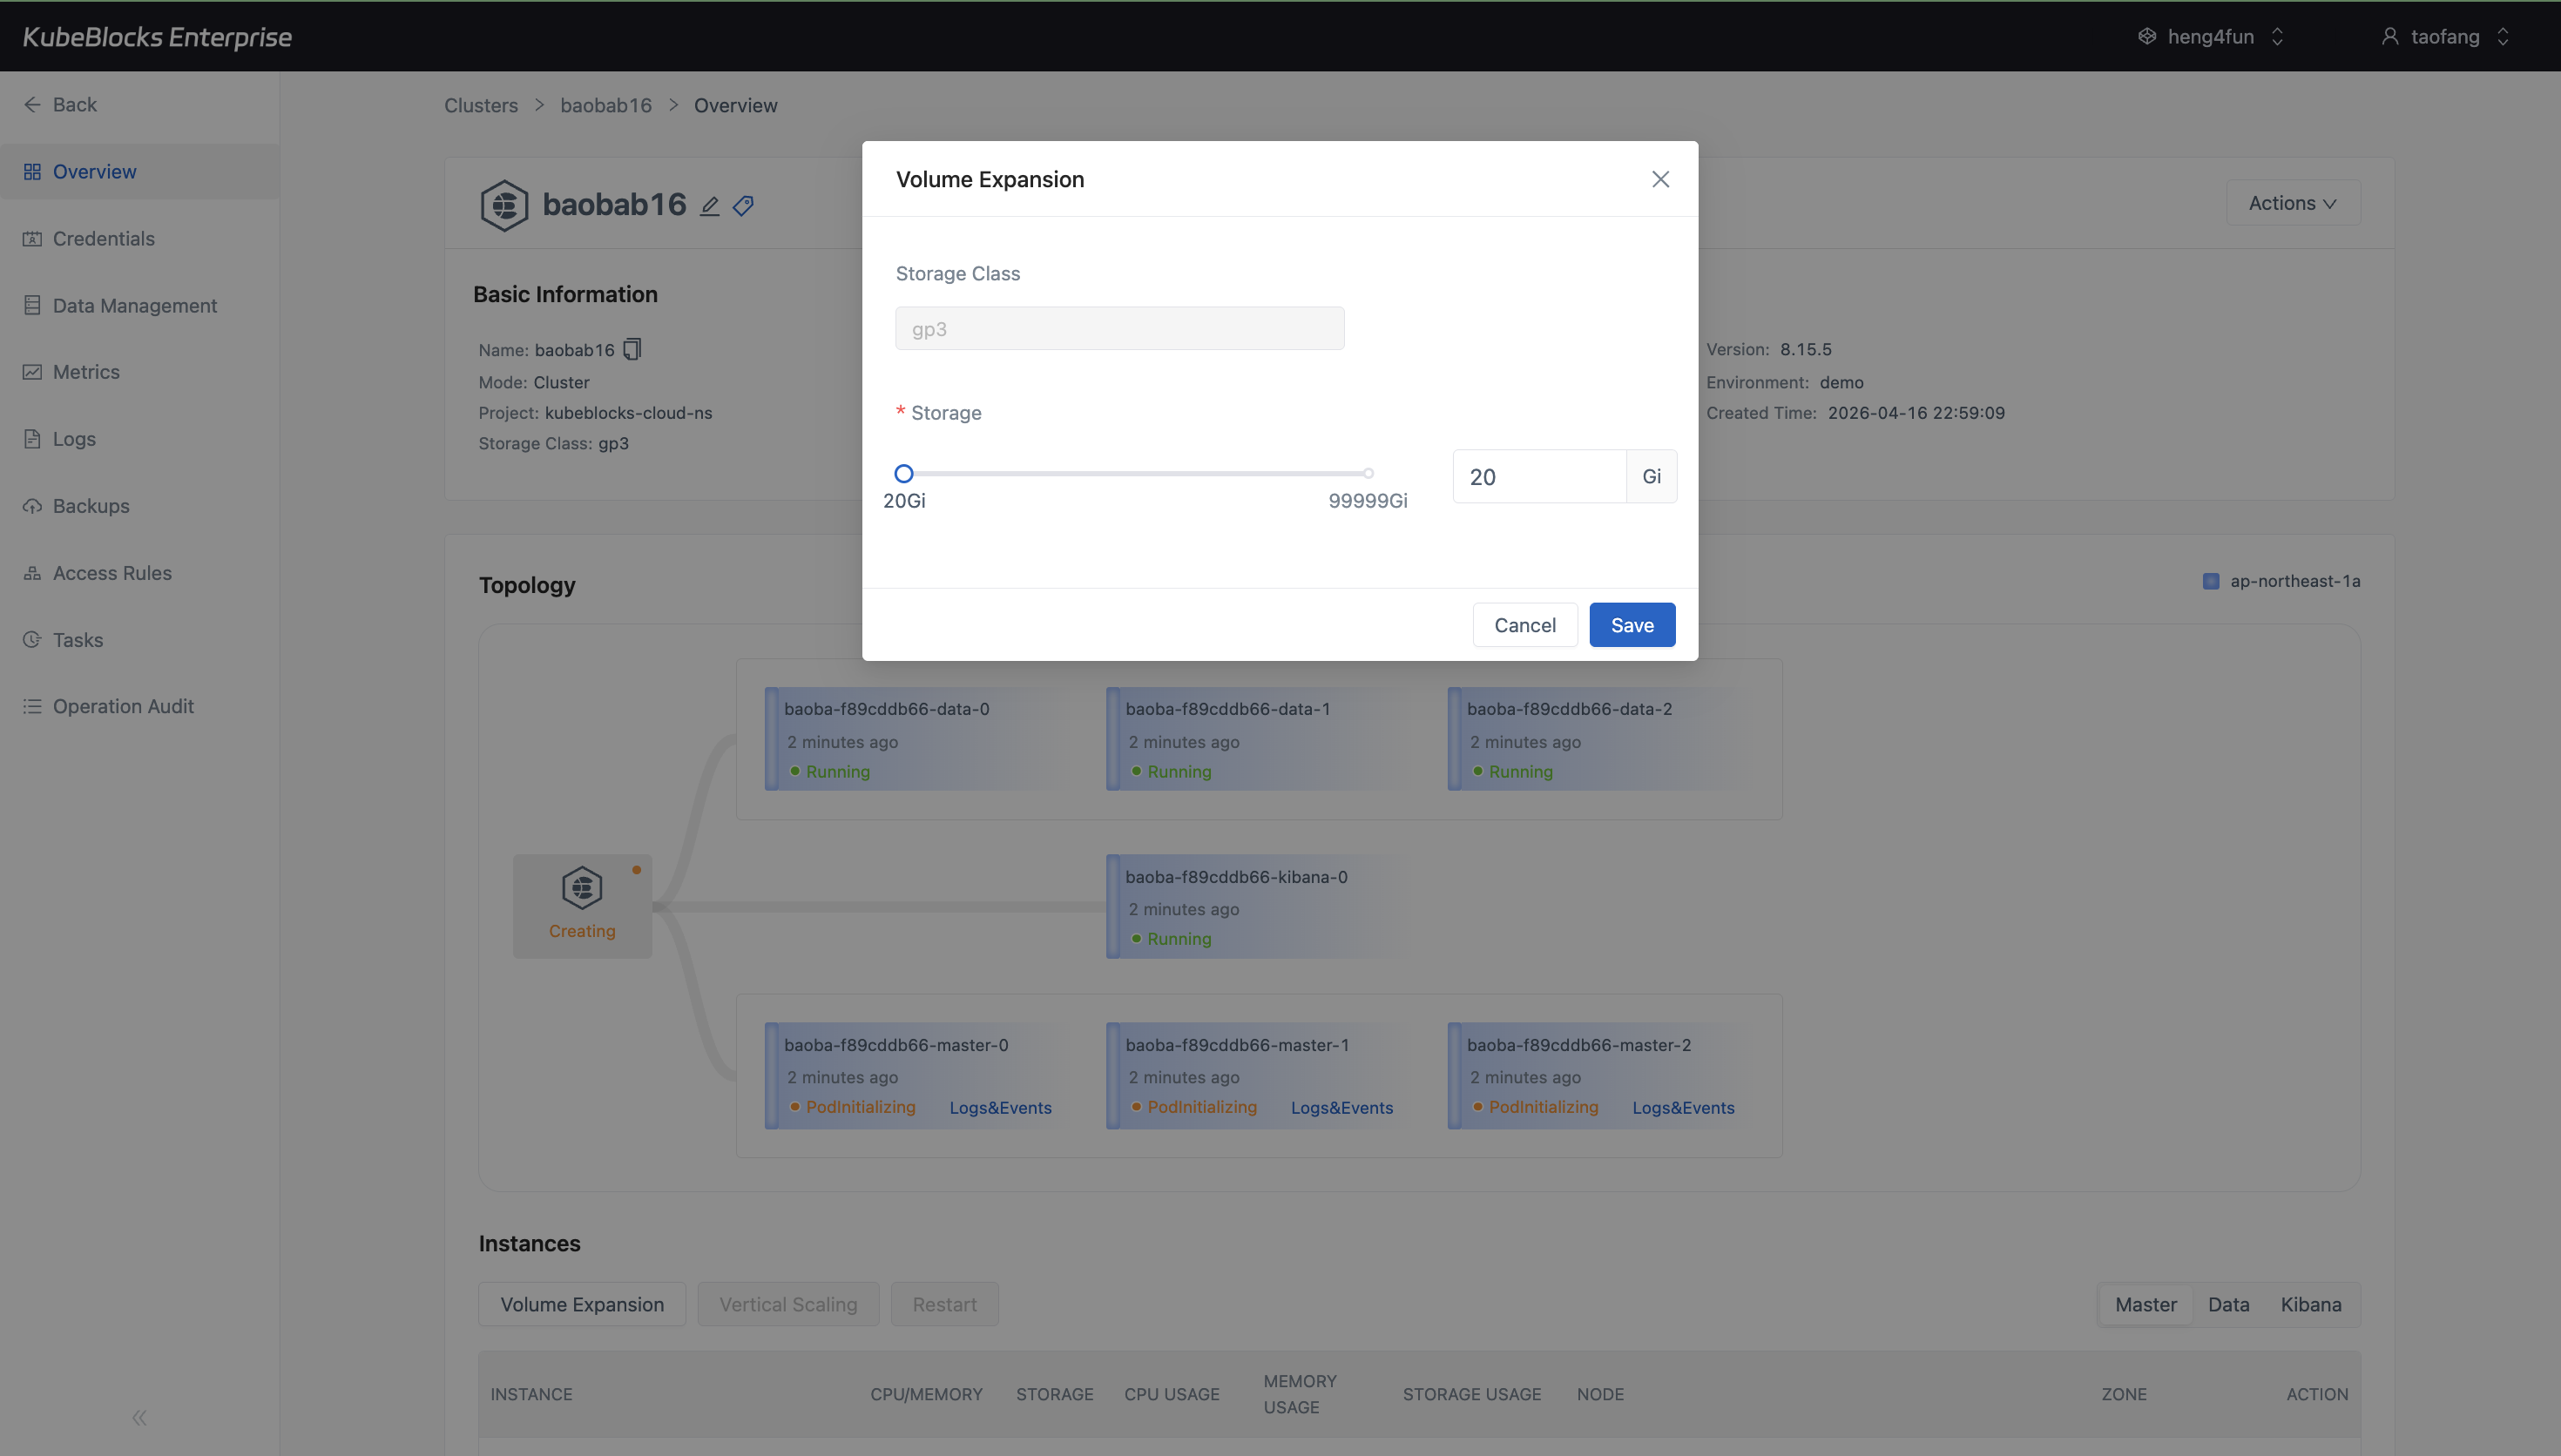
Volume Expansion keeps the storage class, current capacity, target capacity, and save action visible in one dialog.
Resize Elasticsearch compute and storage from dedicated dialogs
Vertical Scaling and Volume Expansion keep compute and disk growth separate from replica-count changes, so users can review CPU, memory, storage class, capacity, and execution timing before submitting a change.
- Use Vertical Scaling to compare Elasticsearch CPU and memory profiles before applying a compute update.
- Use Volume Expansion to review the current storage class and storage size before growing disks.
- Keep compute and storage planning focused on available choices and limits instead of using post-submit task status as proof of capability.
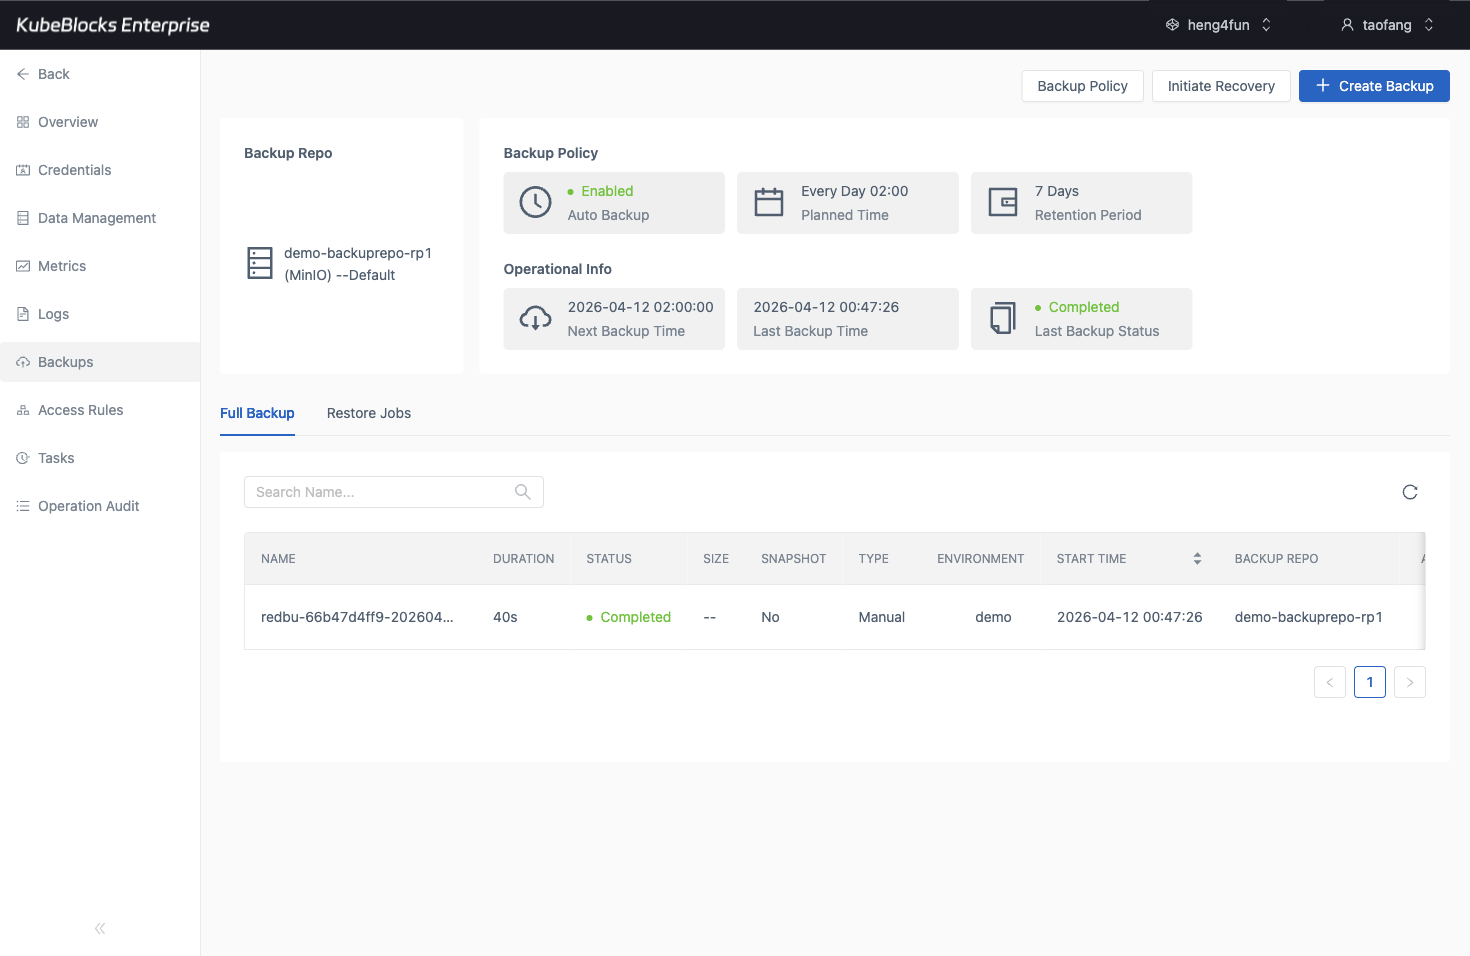
Backup history gives Elasticsearch teams a real protection point before risky operational changes.
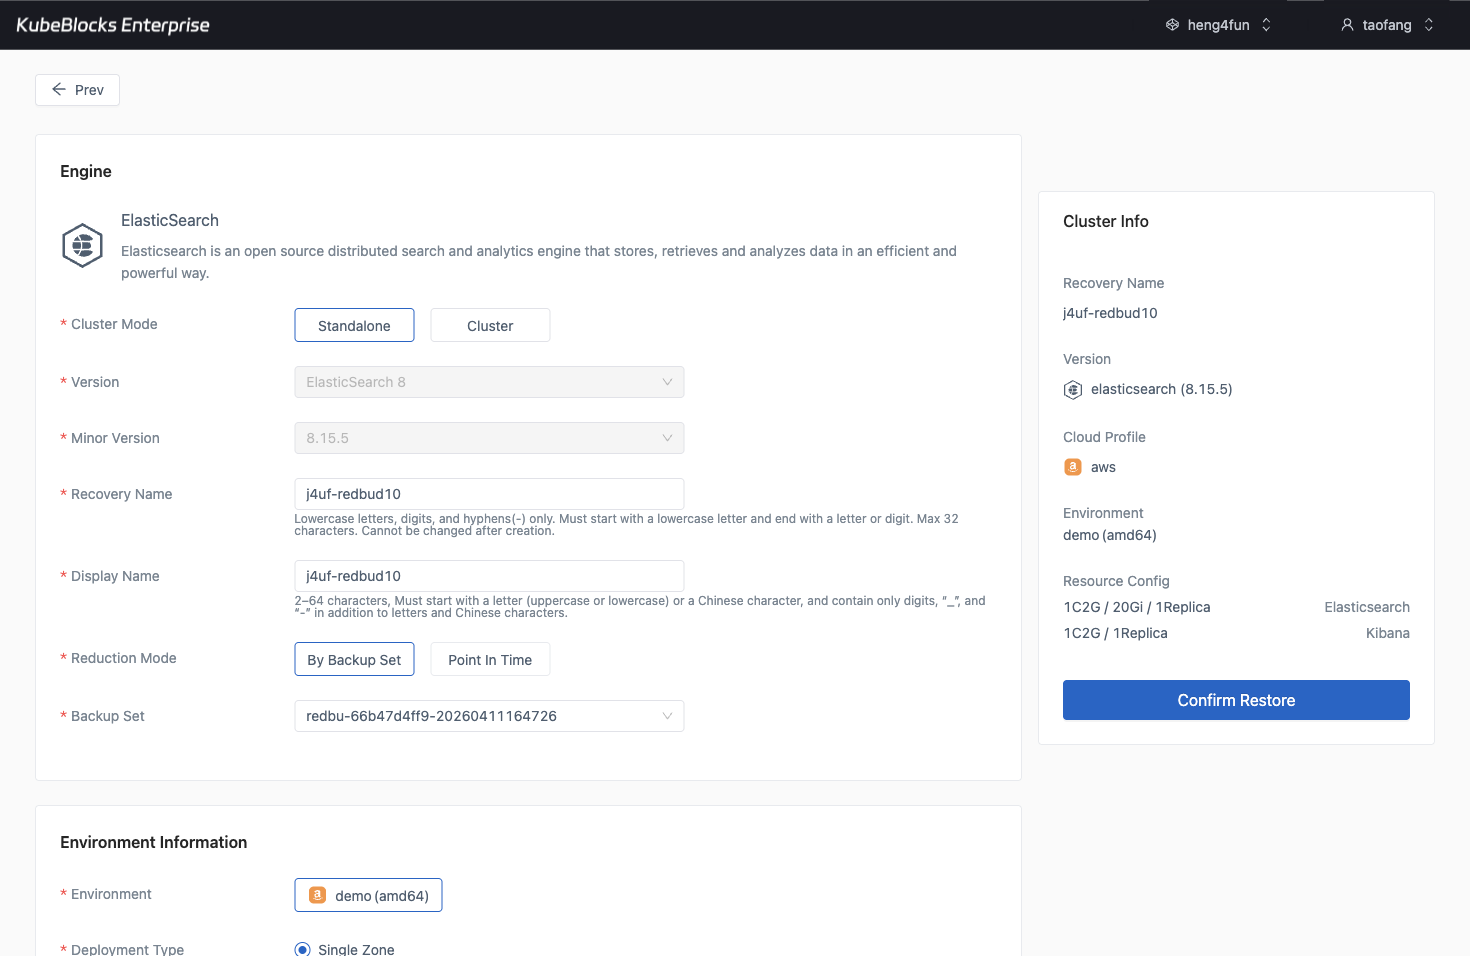
The restore workflow turns an existing Elasticsearch backup into a guided recovery path.
Protect search data with backup and restore workflows
Use the Backups page to review protection points and open Restore from a completed backup when teams need recovery validation or a safer pre-change rollback path.
- Review completed full backups with timestamps, repository context, and status visible in the cluster workspace.
- Launch restore from an existing Elasticsearch backup set instead of recreating recovery inputs by hand.
- Keep data protection separate from routine lifecycle, scaling, and search-validation workflows.
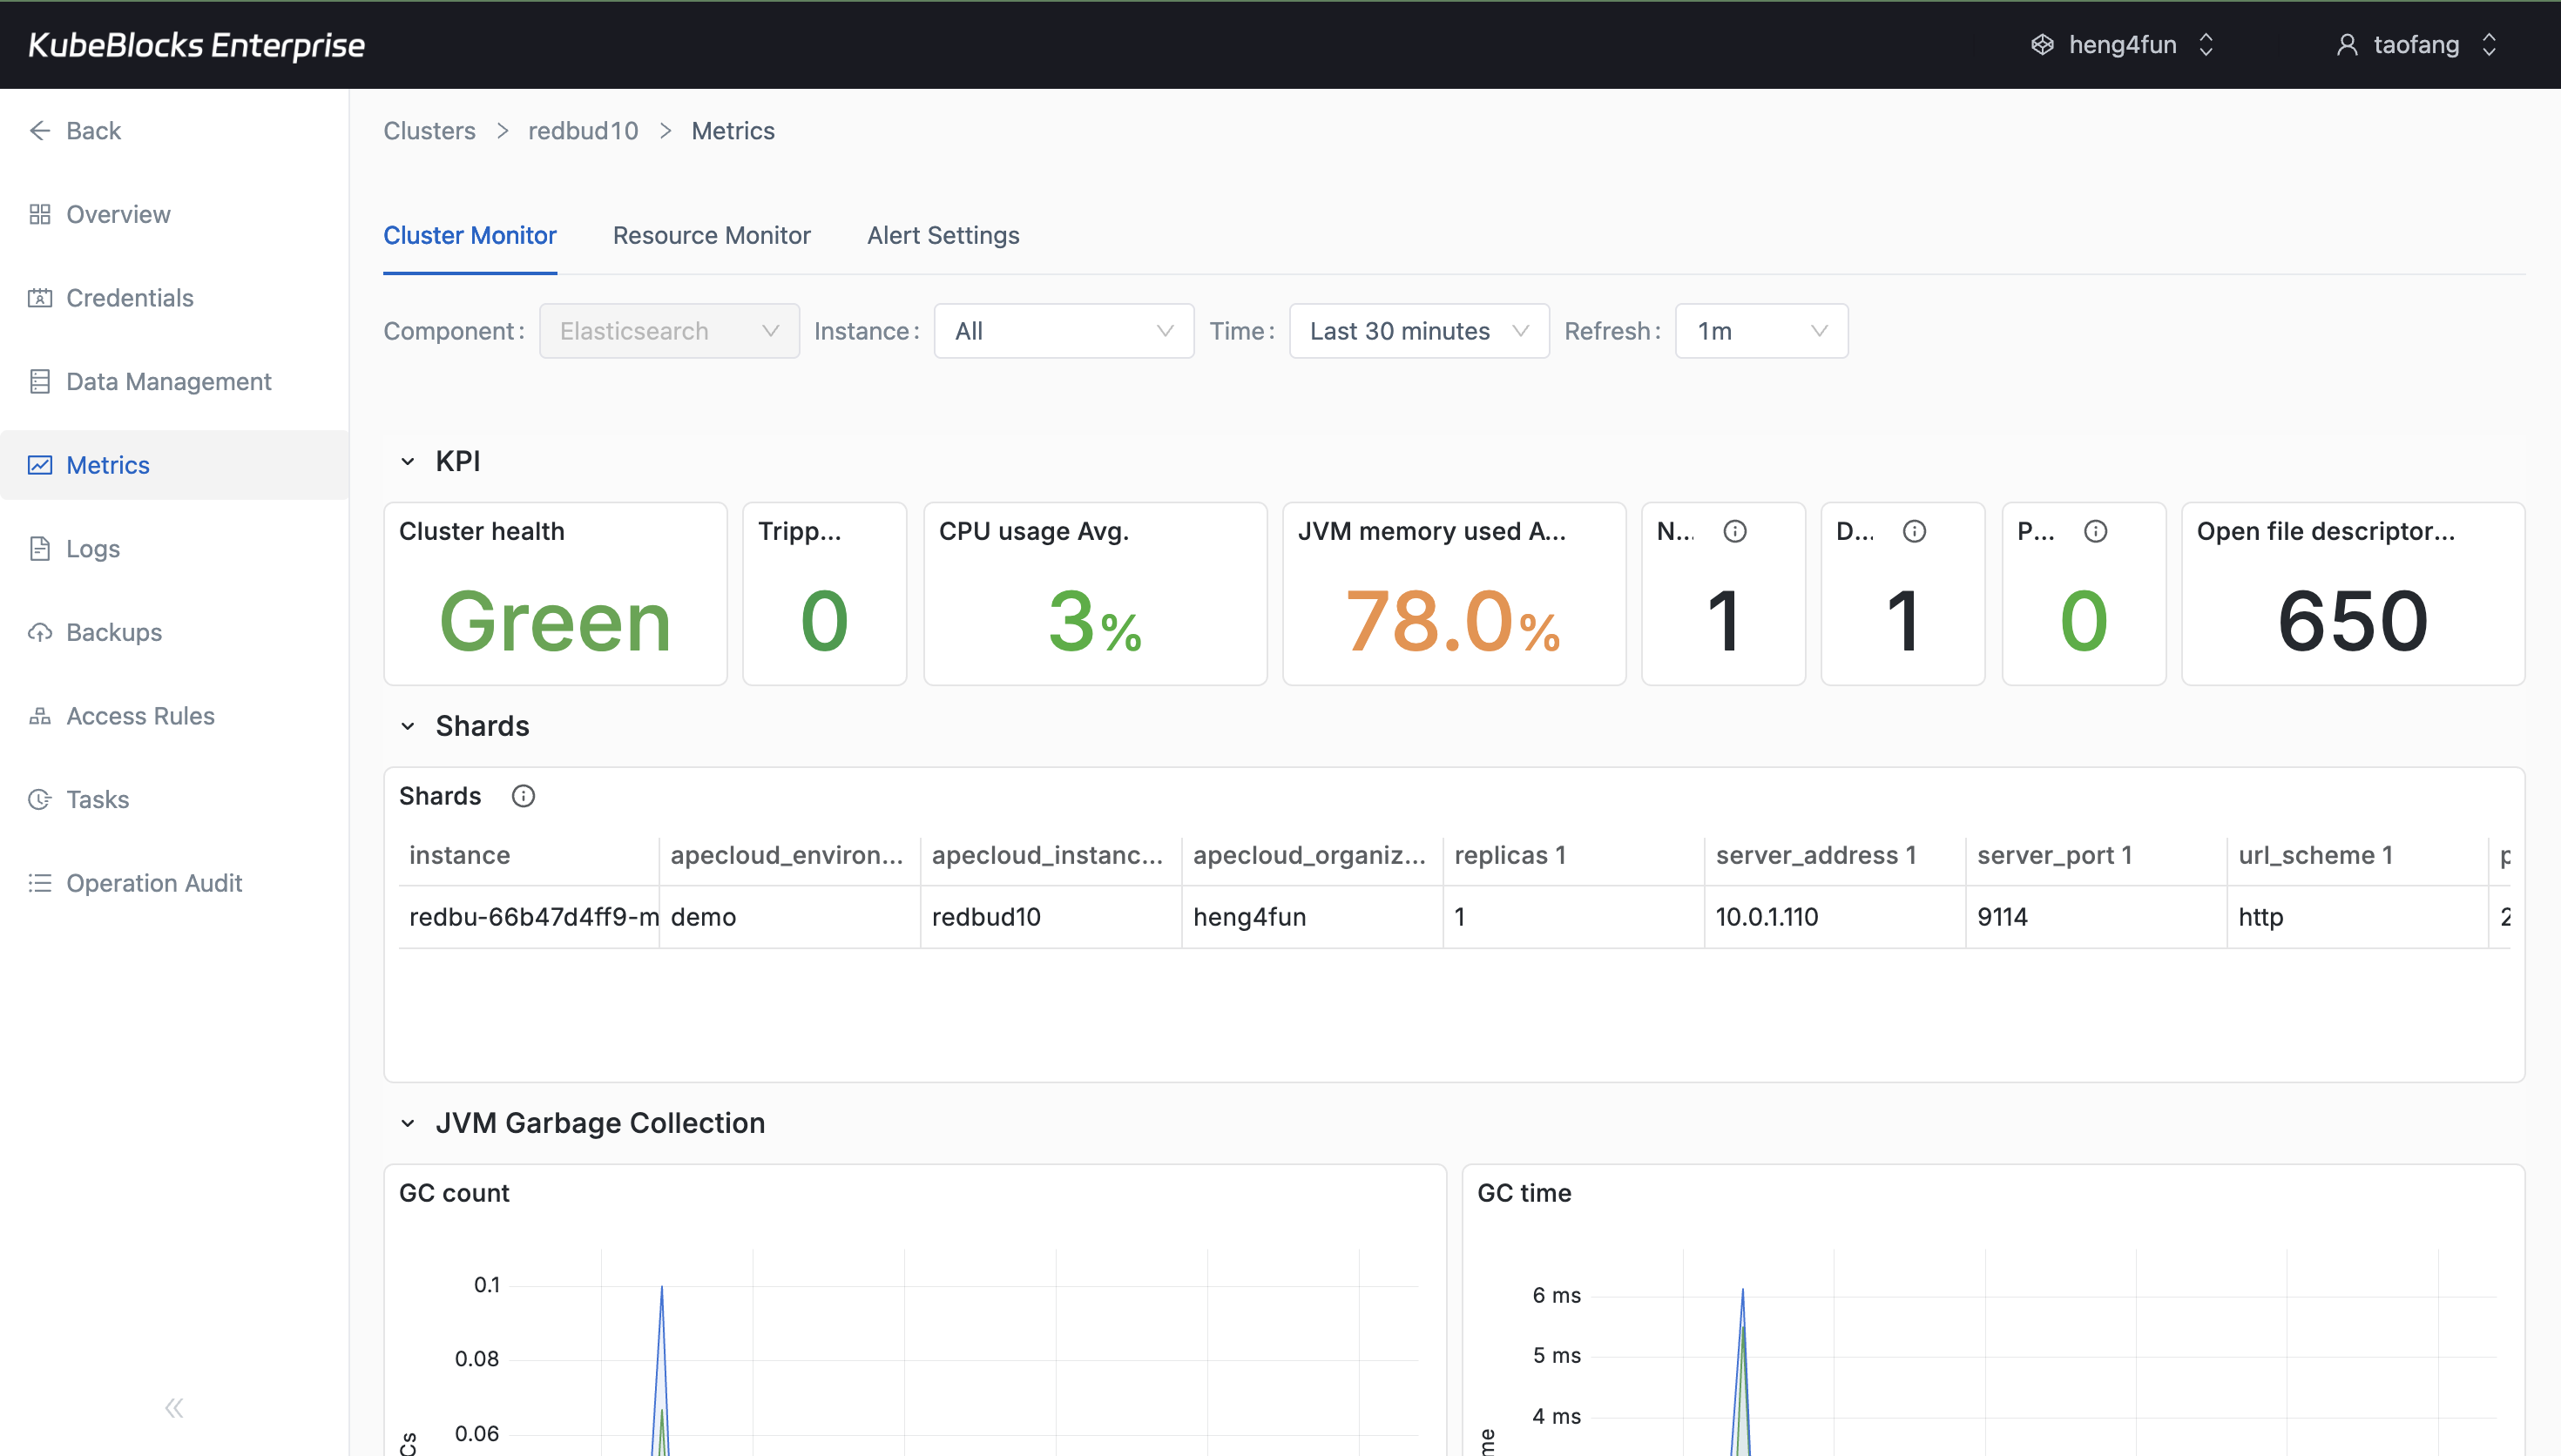
Cluster Monitor gives users a live view into Elasticsearch health and component behavior.
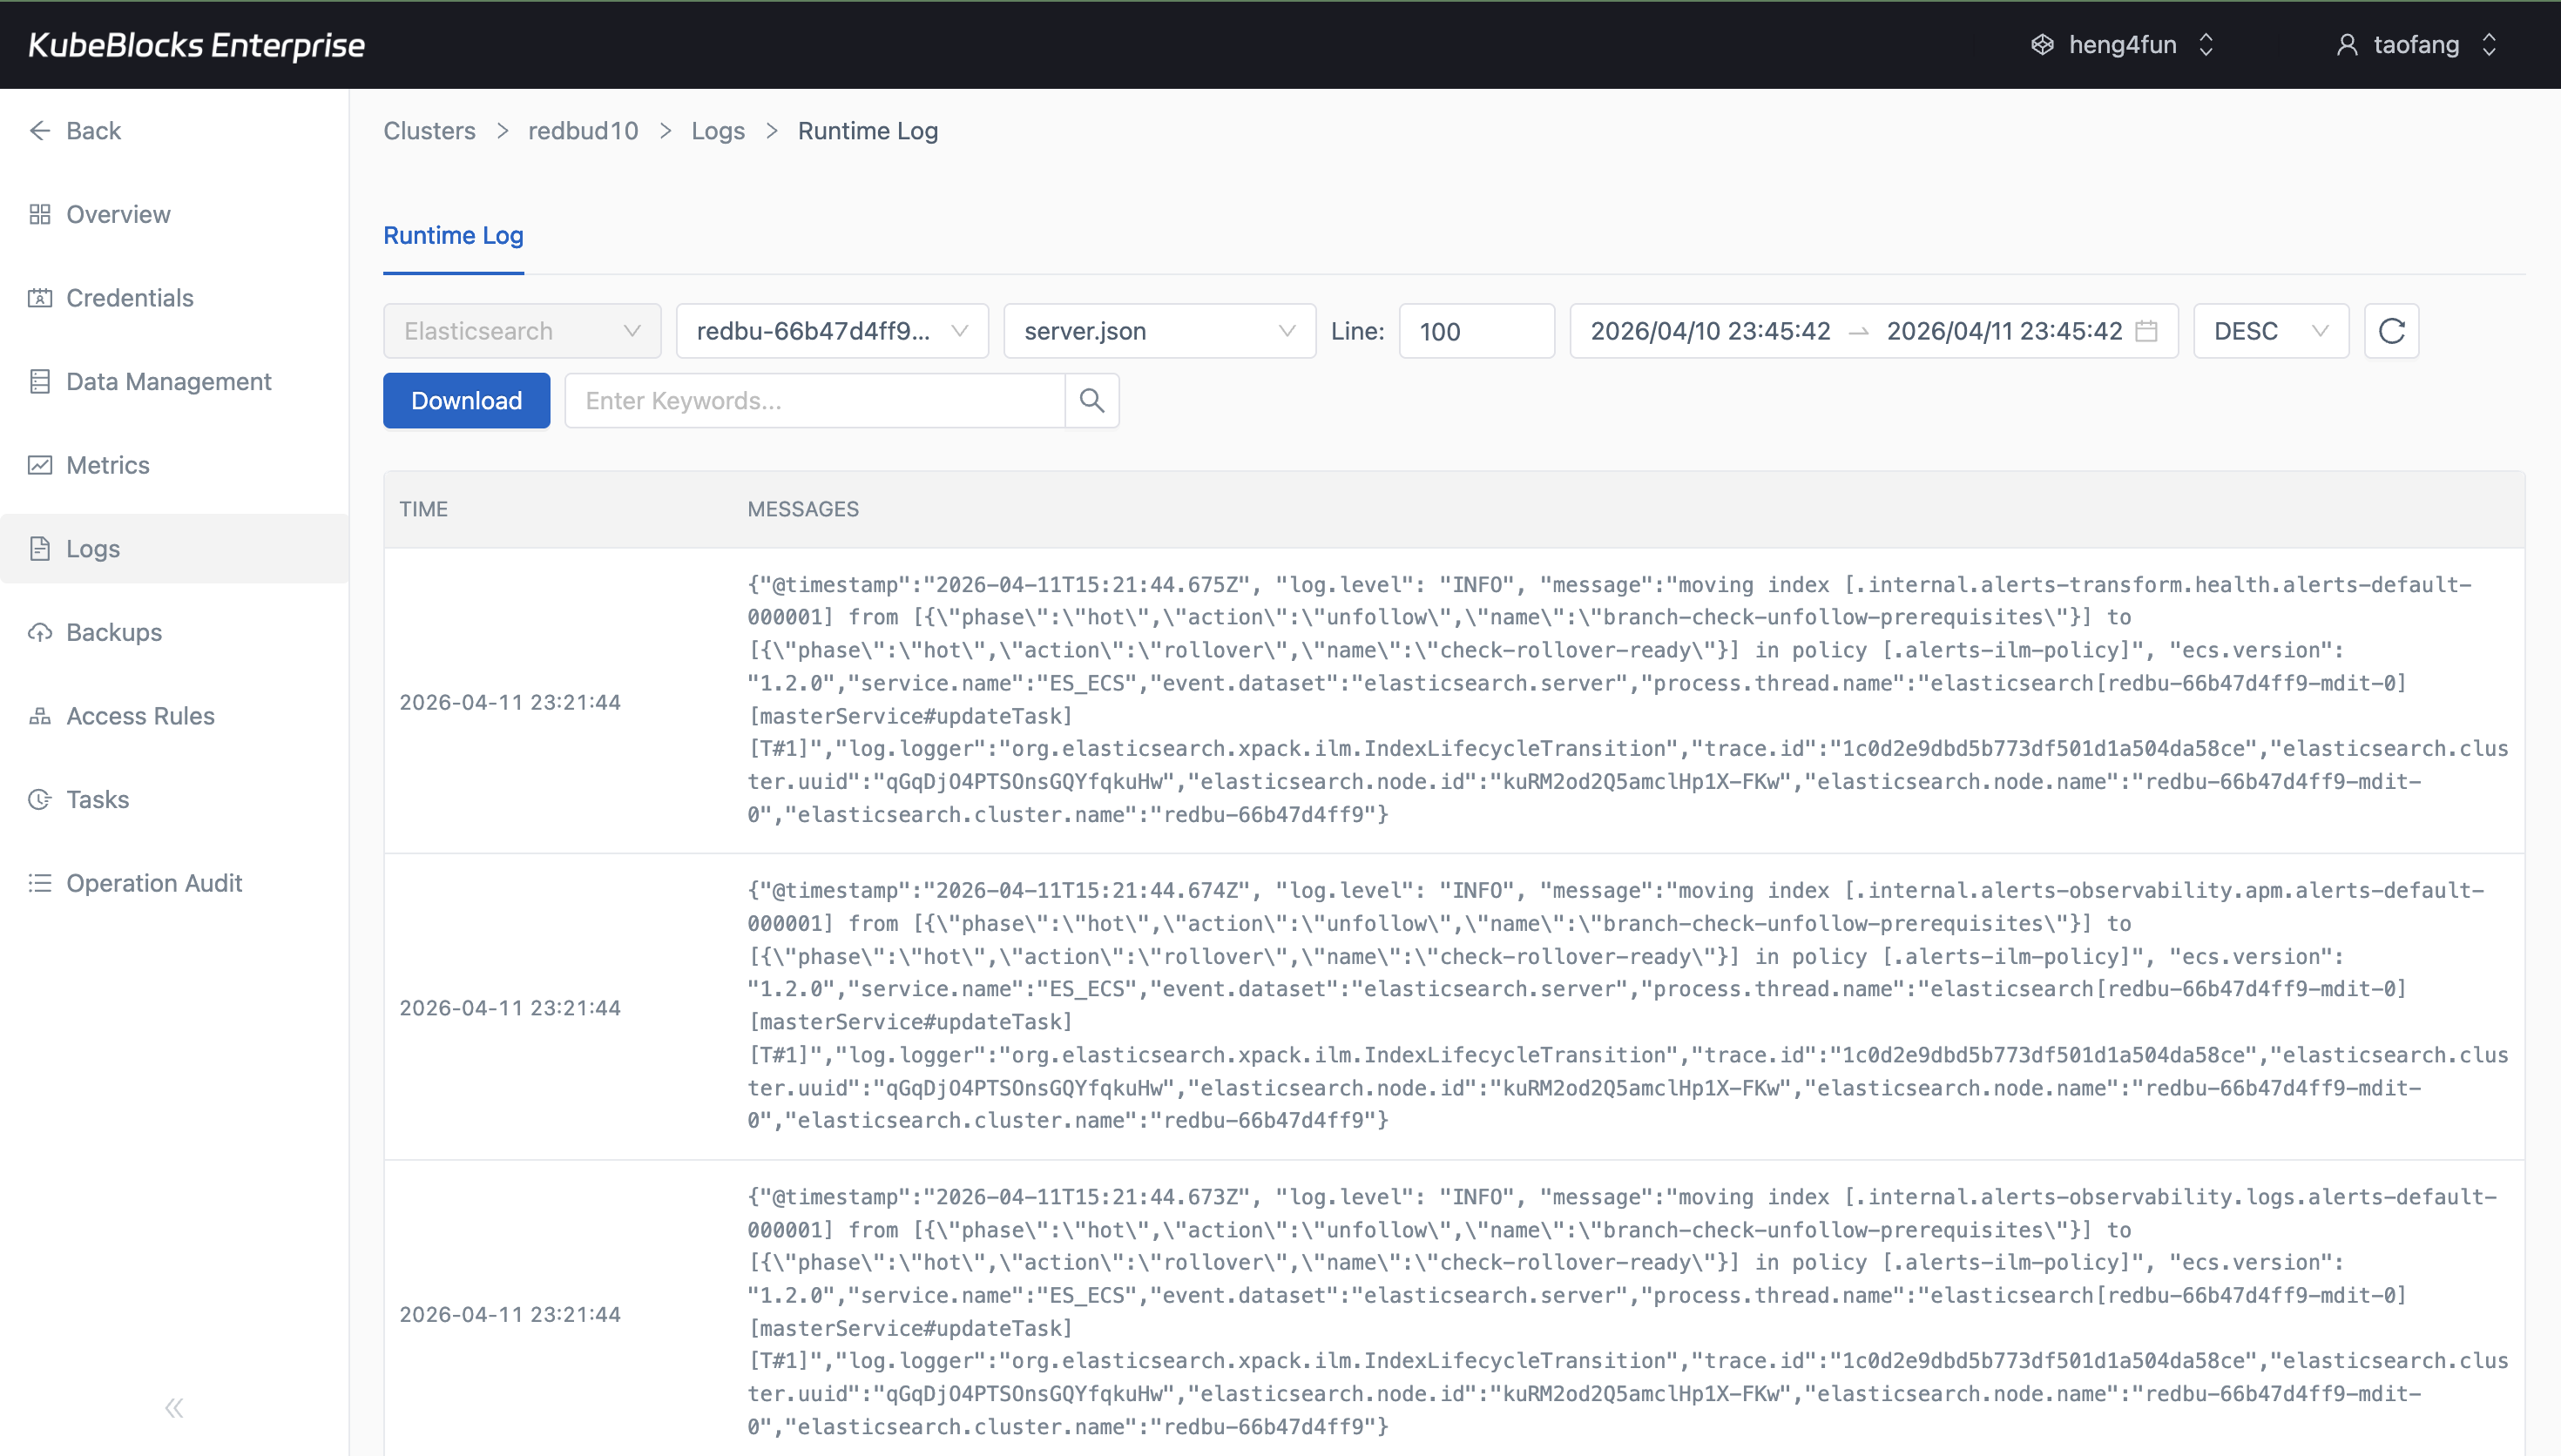
Runtime Log captures real Elasticsearch service output for troubleshooting and operational validation.
Track Elasticsearch health with metrics and runtime logs
Use Cluster Monitor to watch Elasticsearch runtime behavior, then pivot into Runtime Log when users need node-level troubleshooting evidence or service startup details.
- Monitor service status, resource behavior, and component health from the Cluster Monitor page after charts hydrate.
- Inspect real Elasticsearch log output from Runtime Log without leaving the cluster workspace.
- Keep live metrics and log evidence close to the same day-2 operations surface.
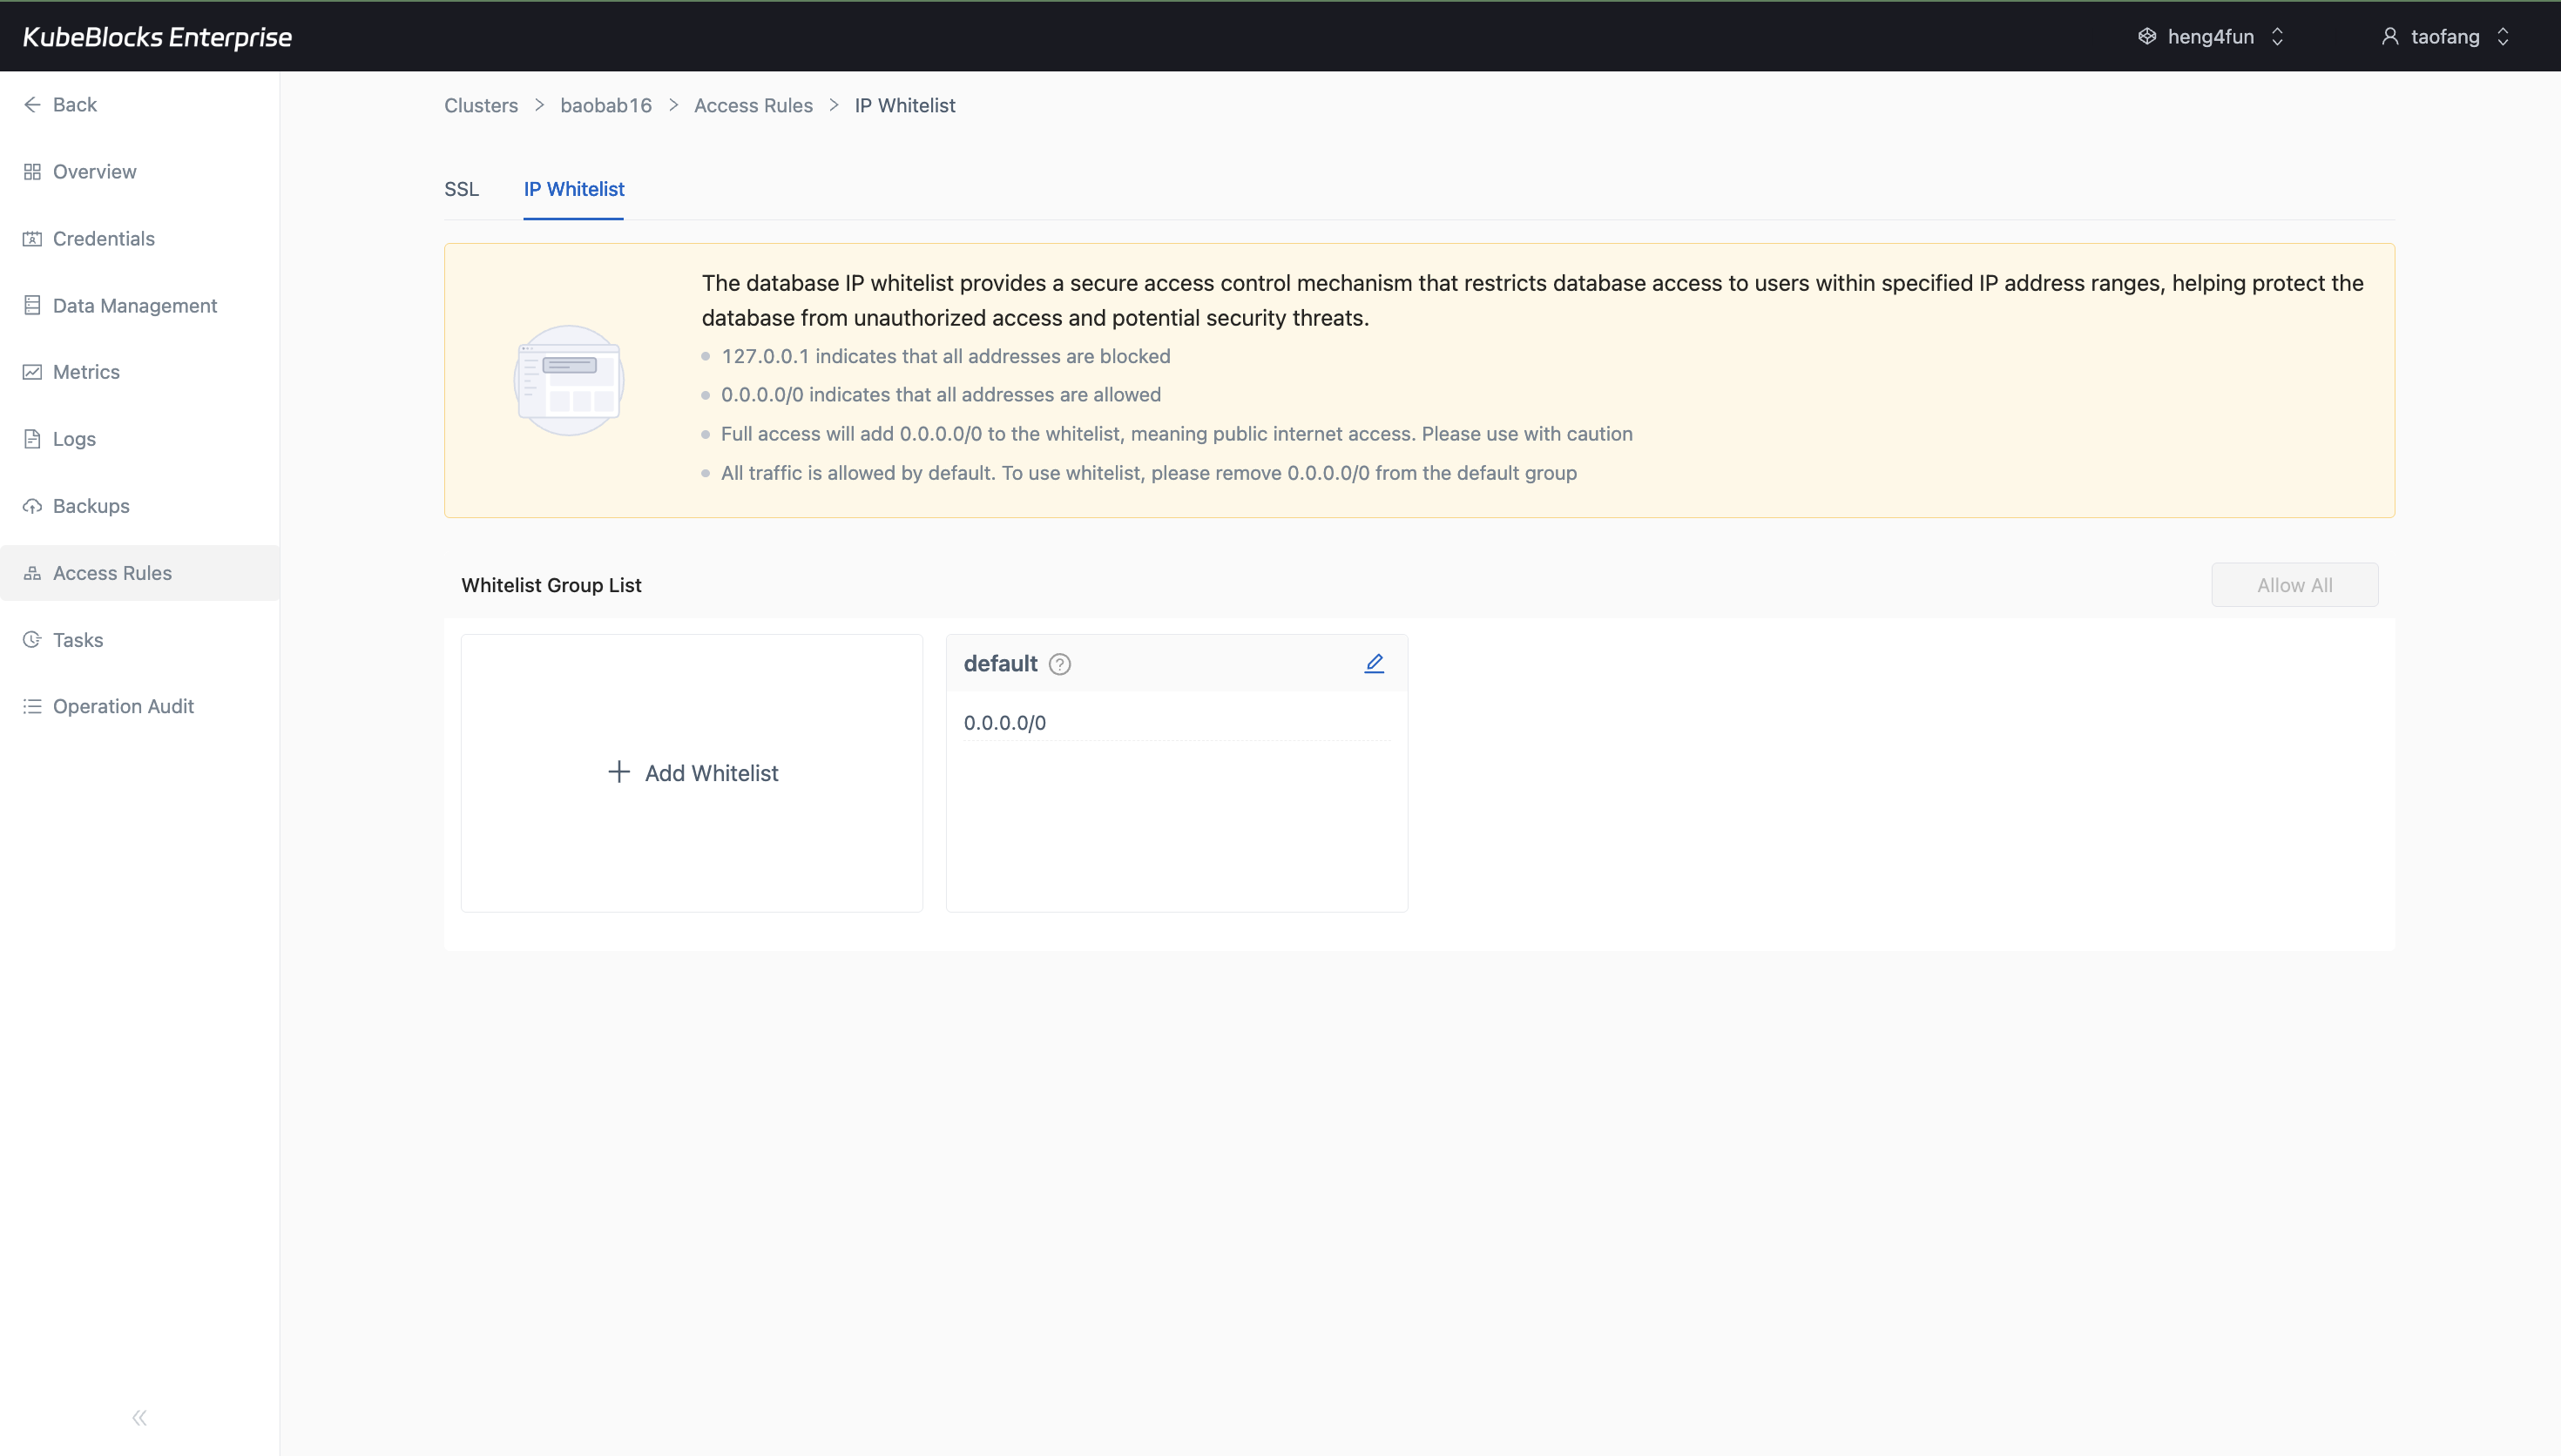
The IP Whitelist page shows the current default group and where users add or tighten source access rules.
Control Elasticsearch access with IP whitelist groups
Access Rules keeps SSL and IP Whitelist controls together. The IP Whitelist page shows the default group, current CIDR entries, and the actions users use to allow or tighten source ranges.
- Open the IP Whitelist tab directly from the Elasticsearch cluster workspace.
- Review the default whitelist group and the current `0.0.0.0/0` entry before narrowing source access.
- Add stricter whitelist groups from the same page when users need more controlled network access.
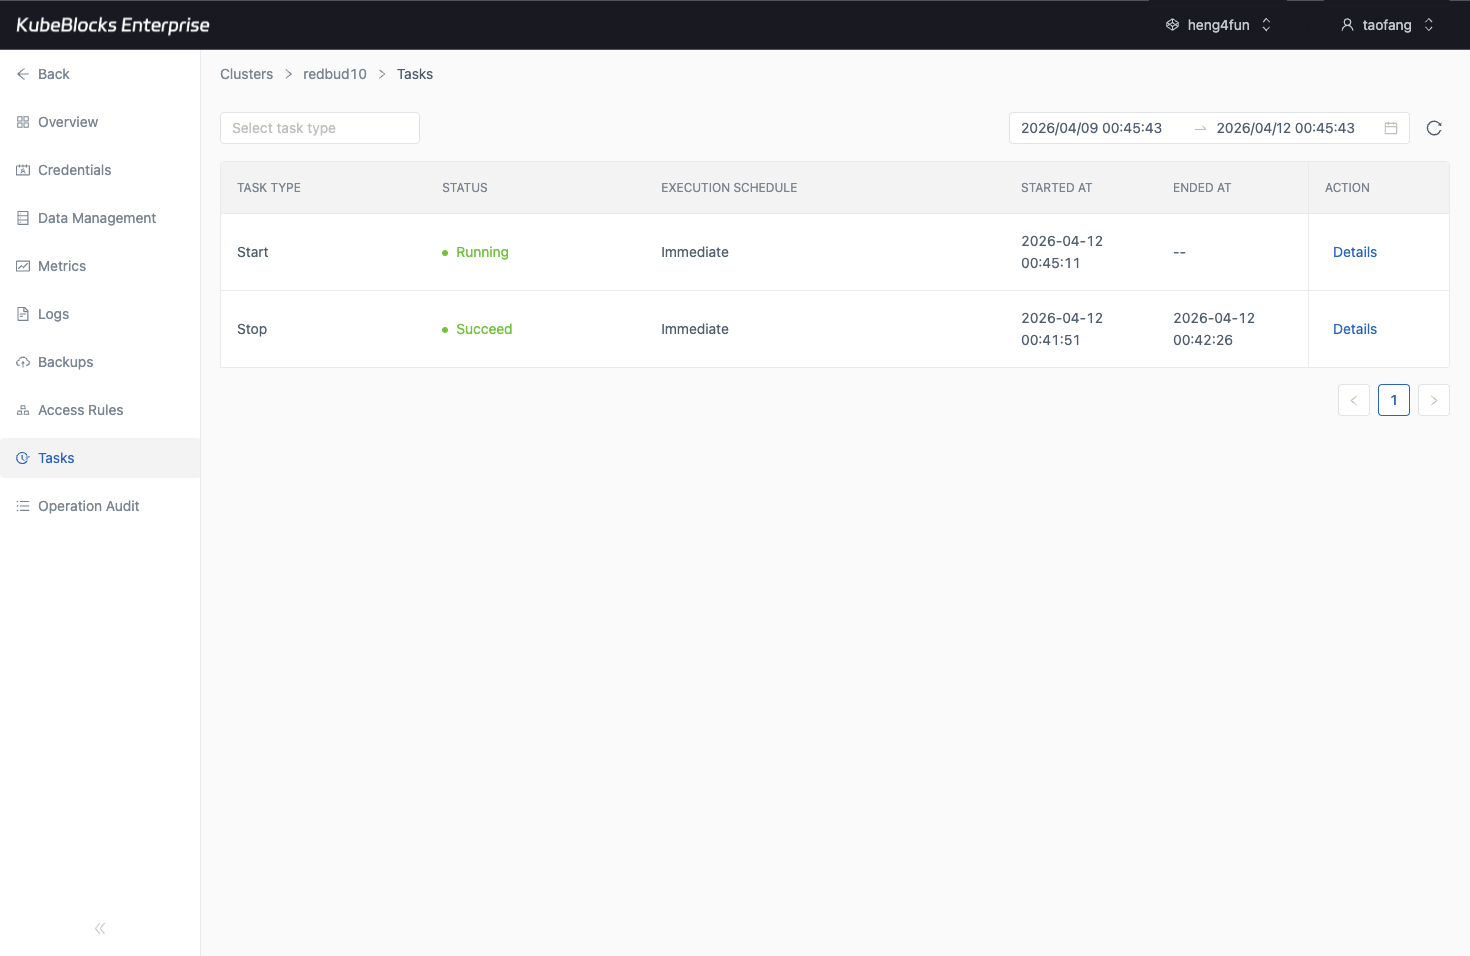
Task history gives teams a practical audit trail for Elasticsearch lifecycle and capacity changes.
Trace Elasticsearch operations from task history
Task history records lifecycle, scaling, backup, restore, and other operational changes so teams can review what changed before handing the cluster back to users.
- Review operation type, status, execution schedule, start time, and end time from one task timeline.
- Confirm day-2 operations finish successfully before application teams resume normal work.
- Use task history as lightweight evidence for change review and operational handoff.
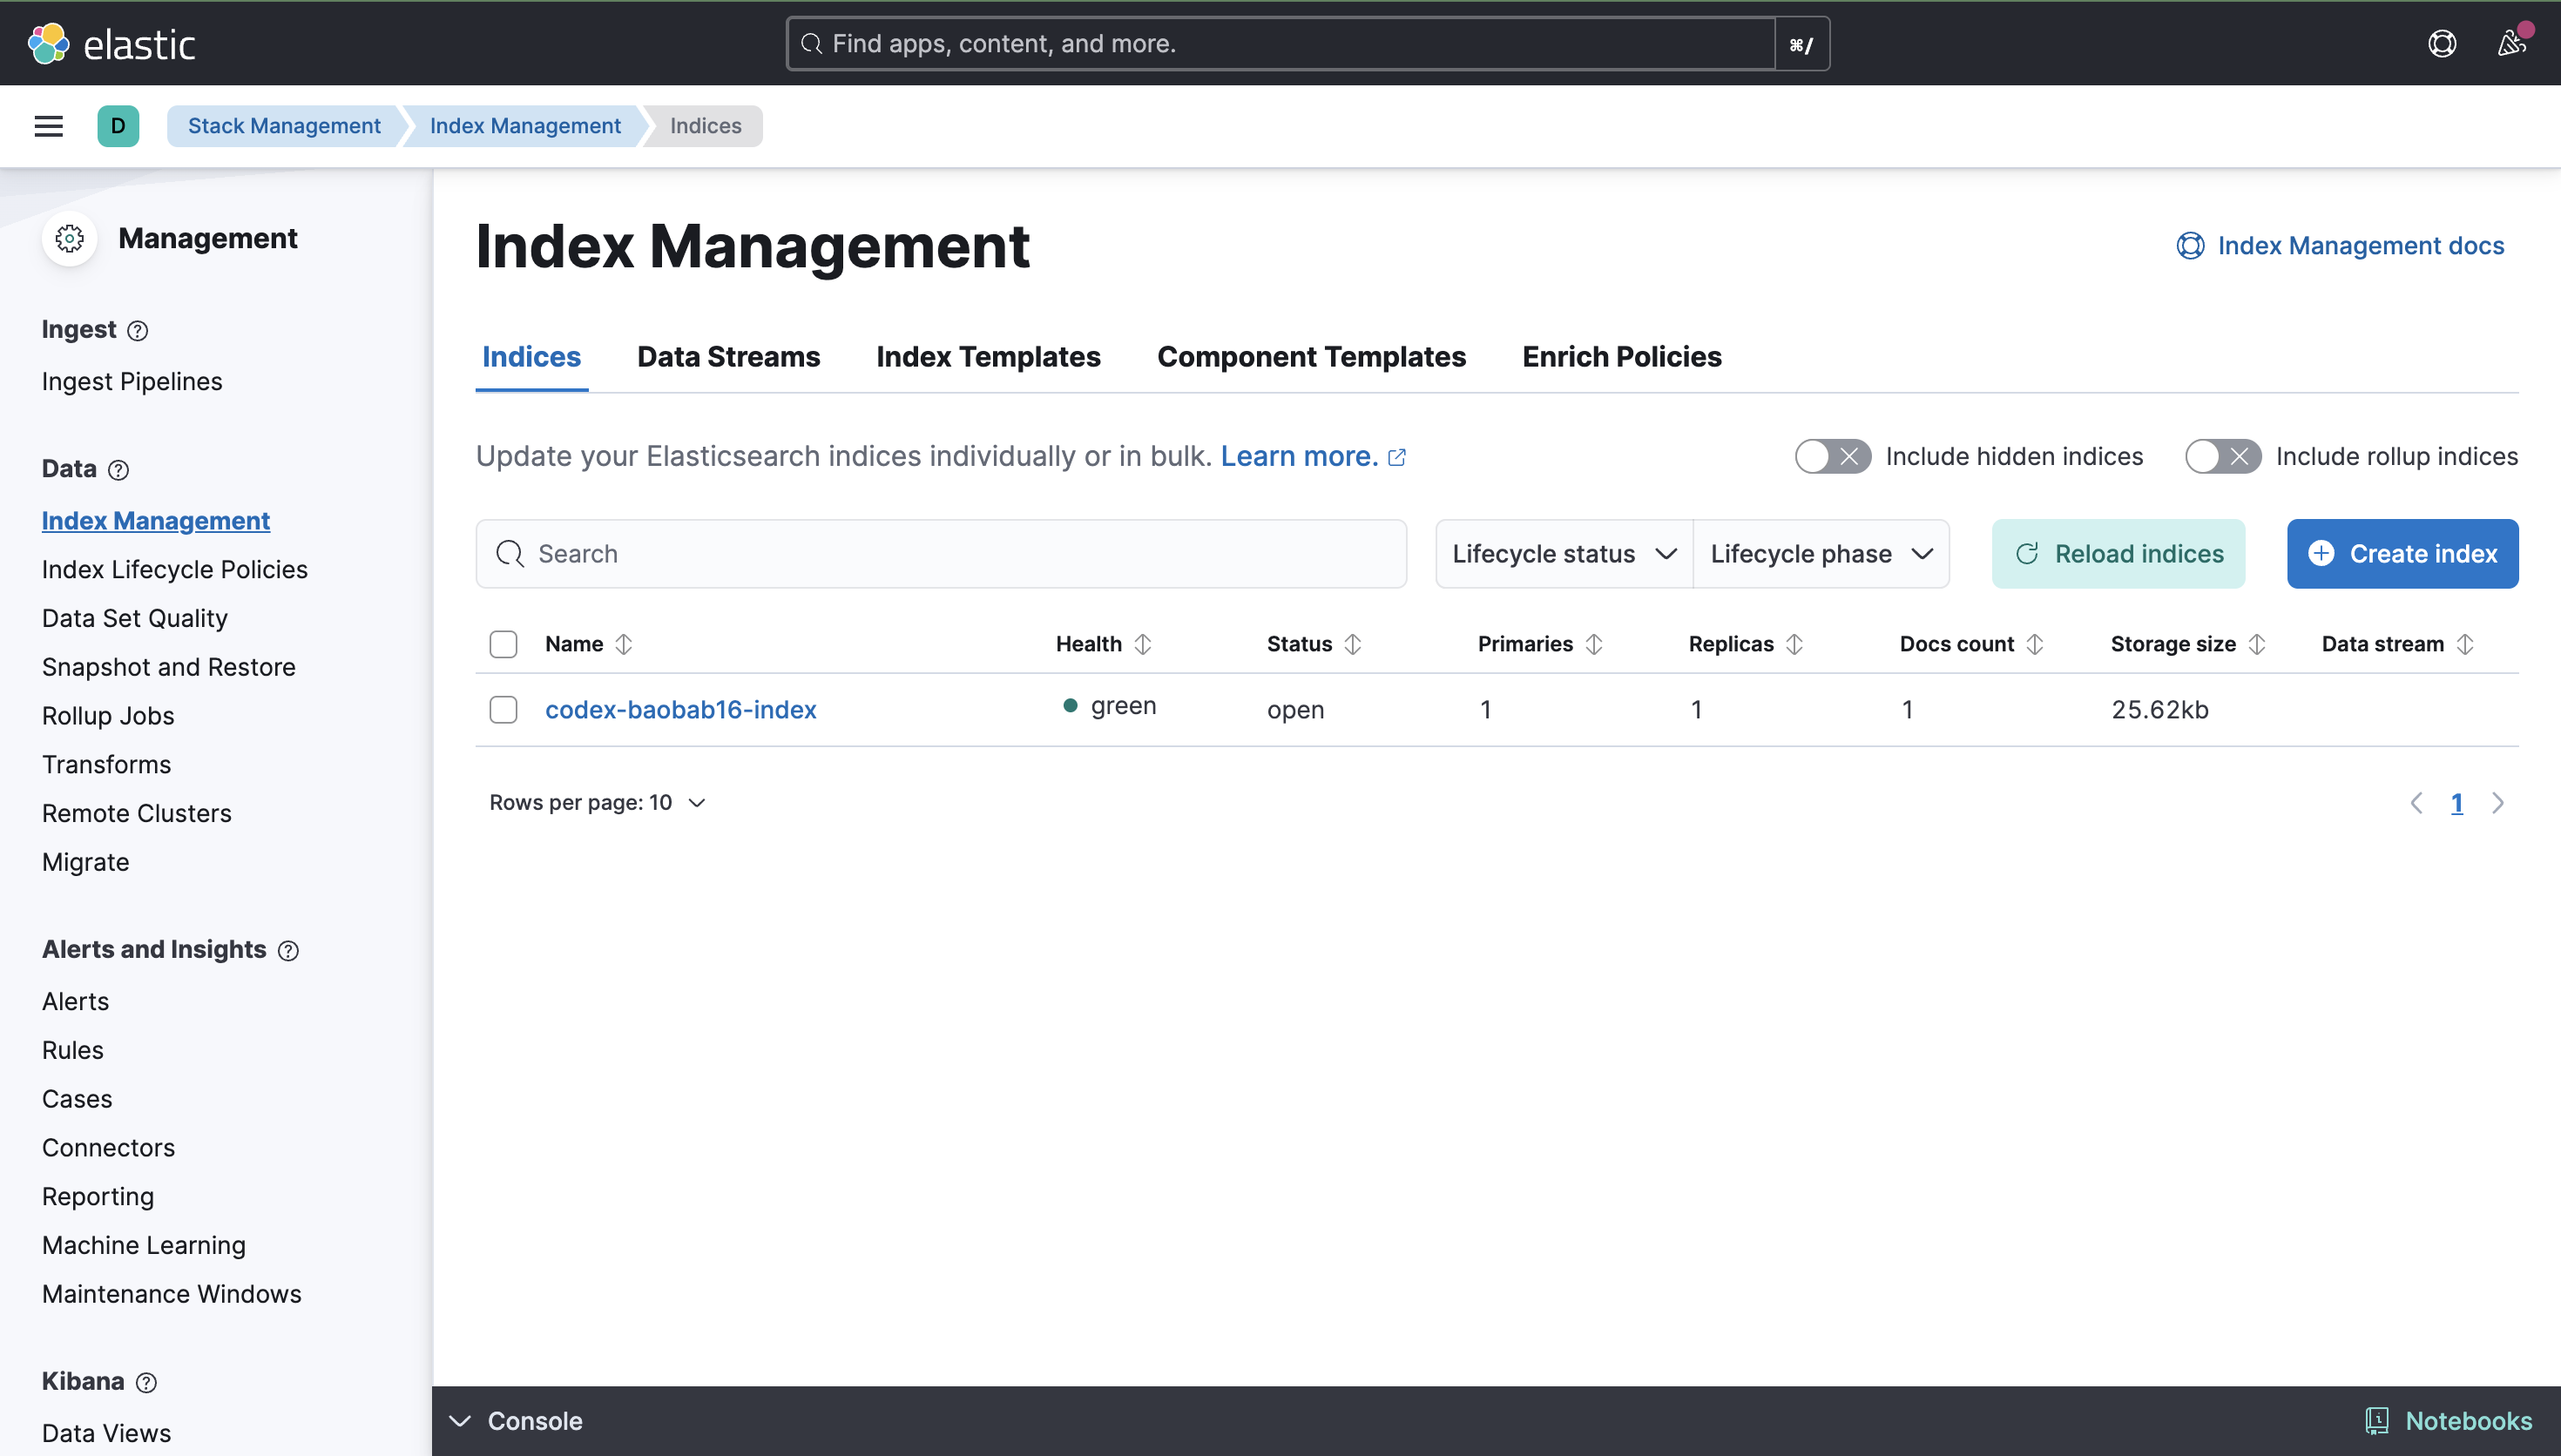
The public Kibana endpoint lets users sign in with cluster credentials and validate Elasticsearch data workflows from the live UI.
Use Credentials and the public Kibana endpoint for search workflows
Enable Data Management with a public LoadBalancer, use the Elasticsearch UI account from Credentials to sign in, and validate index or document workflows from the live Kibana interface.
- Create the public Data Management endpoint from the Elasticsearch cluster workspace and wait for the LoadBalancer DNS to resolve.
- Use the built-in UI credentials from the Credentials page to sign in to the Kibana endpoint.
- Validate a real index or document workflow inside Kibana instead of stopping at the endpoint handoff screen.
Want full Day-2 operations on Kubernetes? Supported by KubeBlocks Elasticsearch Kubernetes Operator →
Ready to build your own DBaaS on Kubernetes?
Talk to our team and see how KubeBlocks Enterprise can help you consolidate databases, strengthen security, and reduce operational costs.